201
FIS Viewer
pressing CTRL+F.
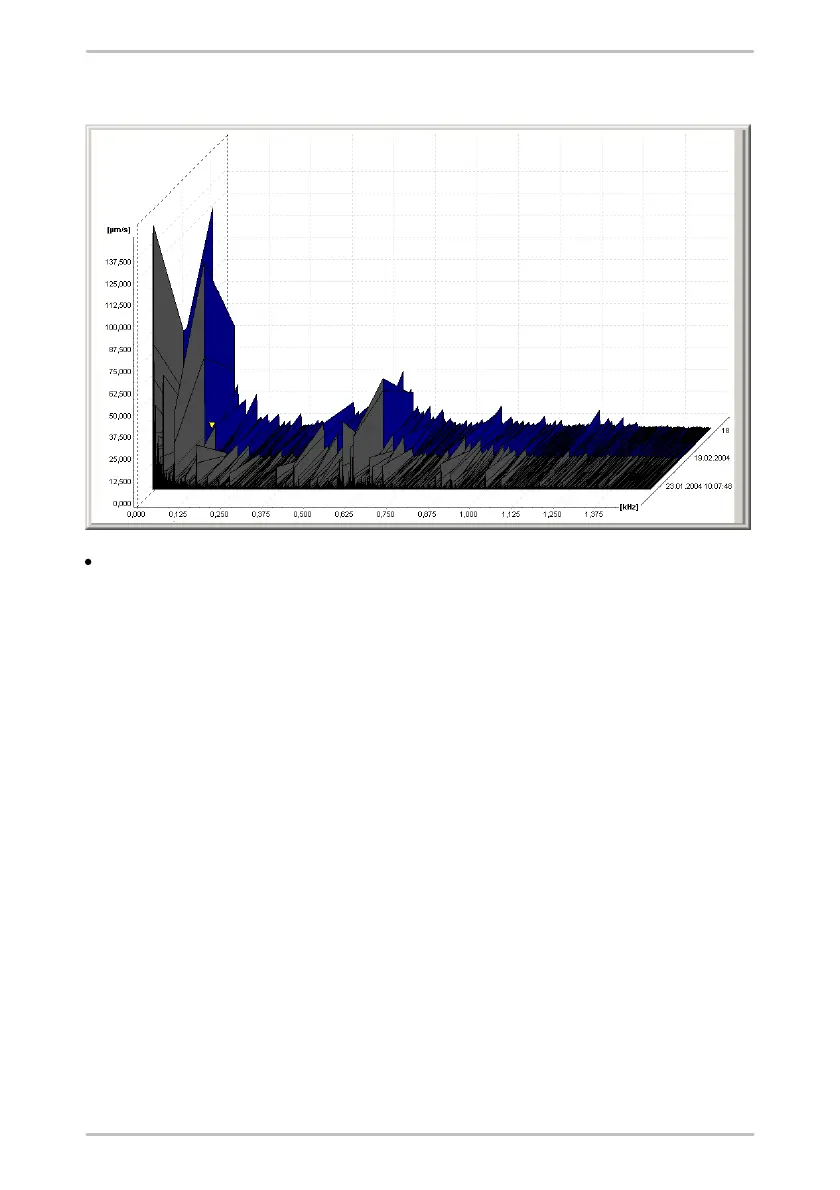
Sonagram: For this type of display, the diagrams are displayed as colored
surfaces on top of each other in which the signal values are indicated as a
color value. This type of display is especially well-suited for comparing a large
number of measurements across a long timeframe. Here, the sonogram
makes it easy to recognize whether a machine is running at a decreasing
speed in a resonance range. If the speed is dropping, the peaks of the FFT will
normally be smaller; in the resonance range they will be larger.