Analyzing Runs
83 G-TECH / Pro Competition User Guide, Release 3.1 83
3
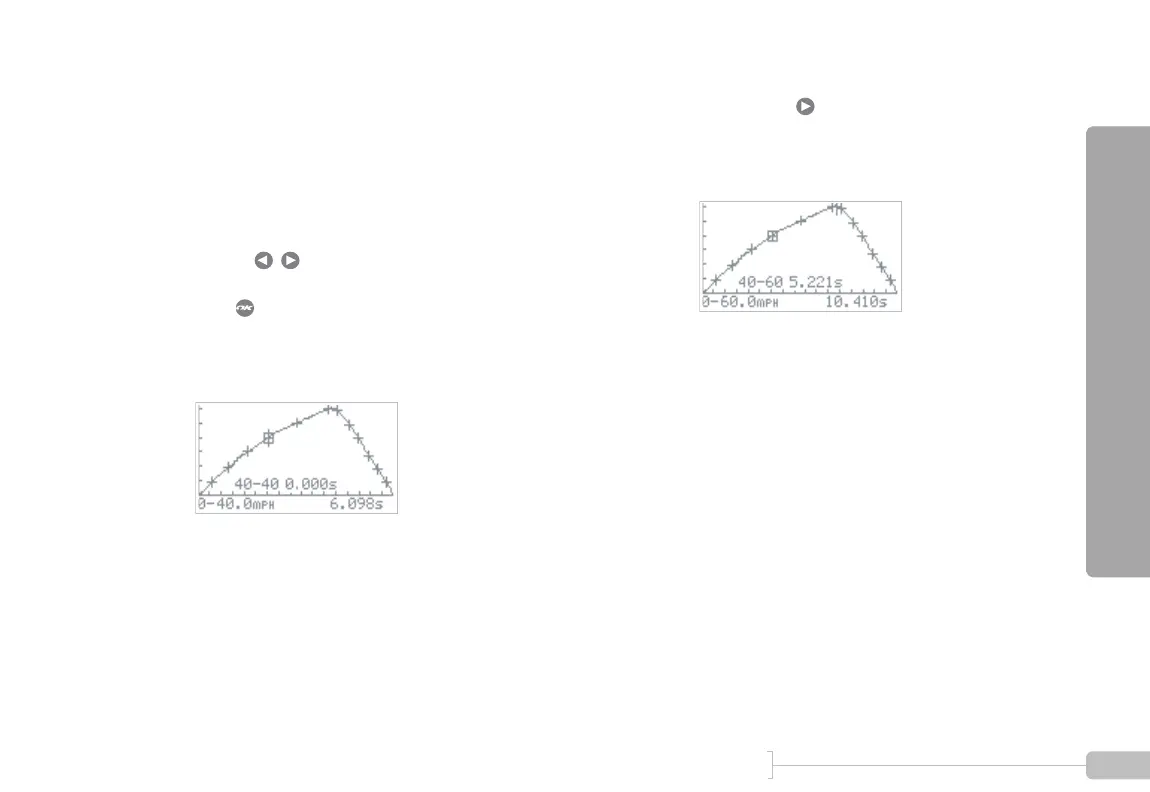
On this graph, notice how the speed (vertical axis)
rises for a while, and then falls again. This is because
the vehicle braked to a complete stop at the end of
the run.
For measuring the 40-60 MPH acceleration time,
we only care about the rising part of the graph, dur-
ing acceleration from 40 to 60 MPH.
Use the keys to move the cursor over the
40 MPH milestone on the rising part of the graph.
Press and a box will be drawn around the 40
MPH milestone.
Since the cursor is still on 40 MPH, a 40-40 MPH
time of 0.000 is displayed.
4
Now use the key to move the cursor over the
60 MPH milestone on the rising part of the graph.
Since the cursor is now on 60 MPH, the 40-60
MPH time is displayed.