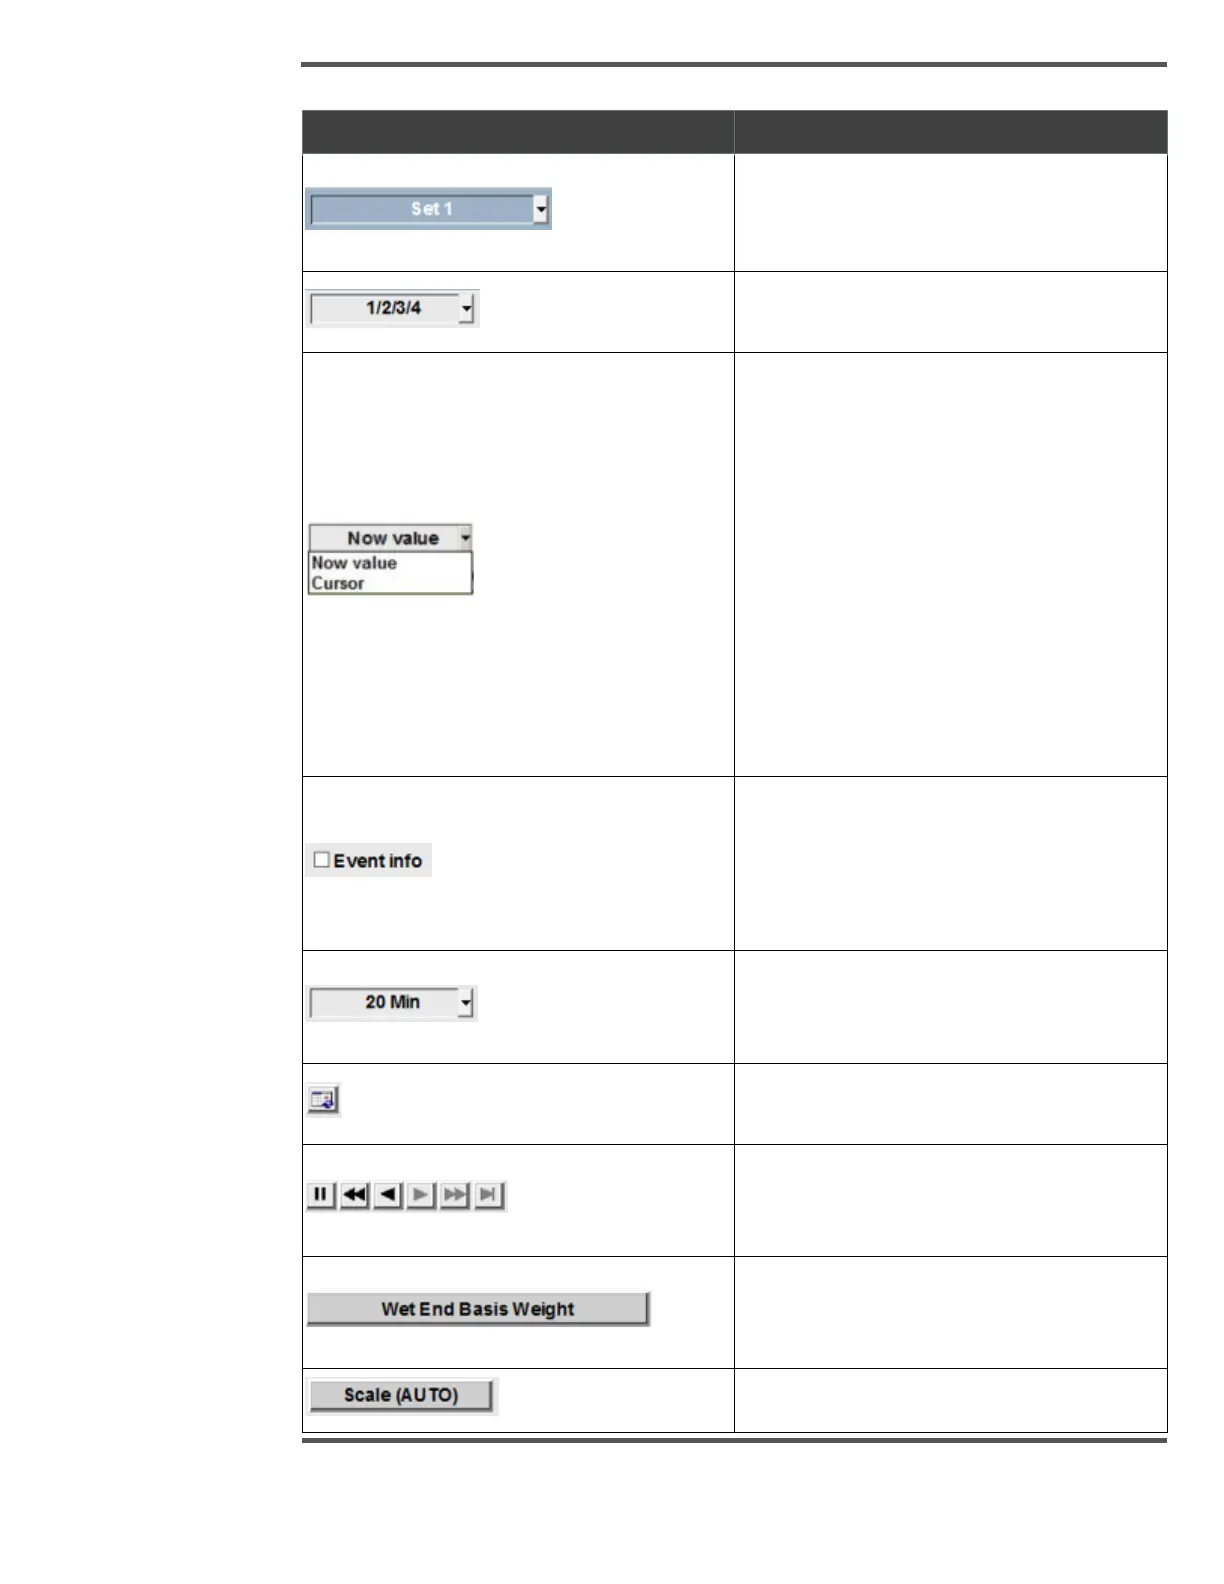
PROCESS INFORMATION DISPLAYS
Trend Set Selection Dropdown:
Trend set is the collection of four user defined
trends.
Display Style: User can select up to 4 display
type
Now Value/ Cursor Dropdown: The cursor
button is used to view and hide the trend
cursor. When enabled, the cursor appears as
a vertical yellow (or chose color) line in the
trend graph. This cursor may be selected with
the pointing device (the mouse or track ball)
and then moved to any location on the graph.
While the cursor is enabled, the box to the
right of the cursor button shows the time at
the cursor location and the trend data values
at the cursor location are shown in the scale
selection frame for each trend (in place of the
“Now” values).
Event Info Check Box: When the user selects
the Event Info check box, the Event Info
popup is opened with more detailed
information about this event, like event name,
start-time, end-time and duration of event.
Time Interval/Display Time Dropdown: This
dropdown allows user to select X-axis user
interval.
Calendar Button: Allows user to view history
data for defined dates and reels
Recording Buttons: These buttons are used
to move the trend graph forward and
backward.
Measurement Selection Button: Allows user
to select a specific measurement to view the
trend data.
Scale Button: Allows user to set Y Axis scale.
 Loading...