EMBEDDED Intel486™ PROCESSOR HARDWARE REFERENCE MANUAL
9-10
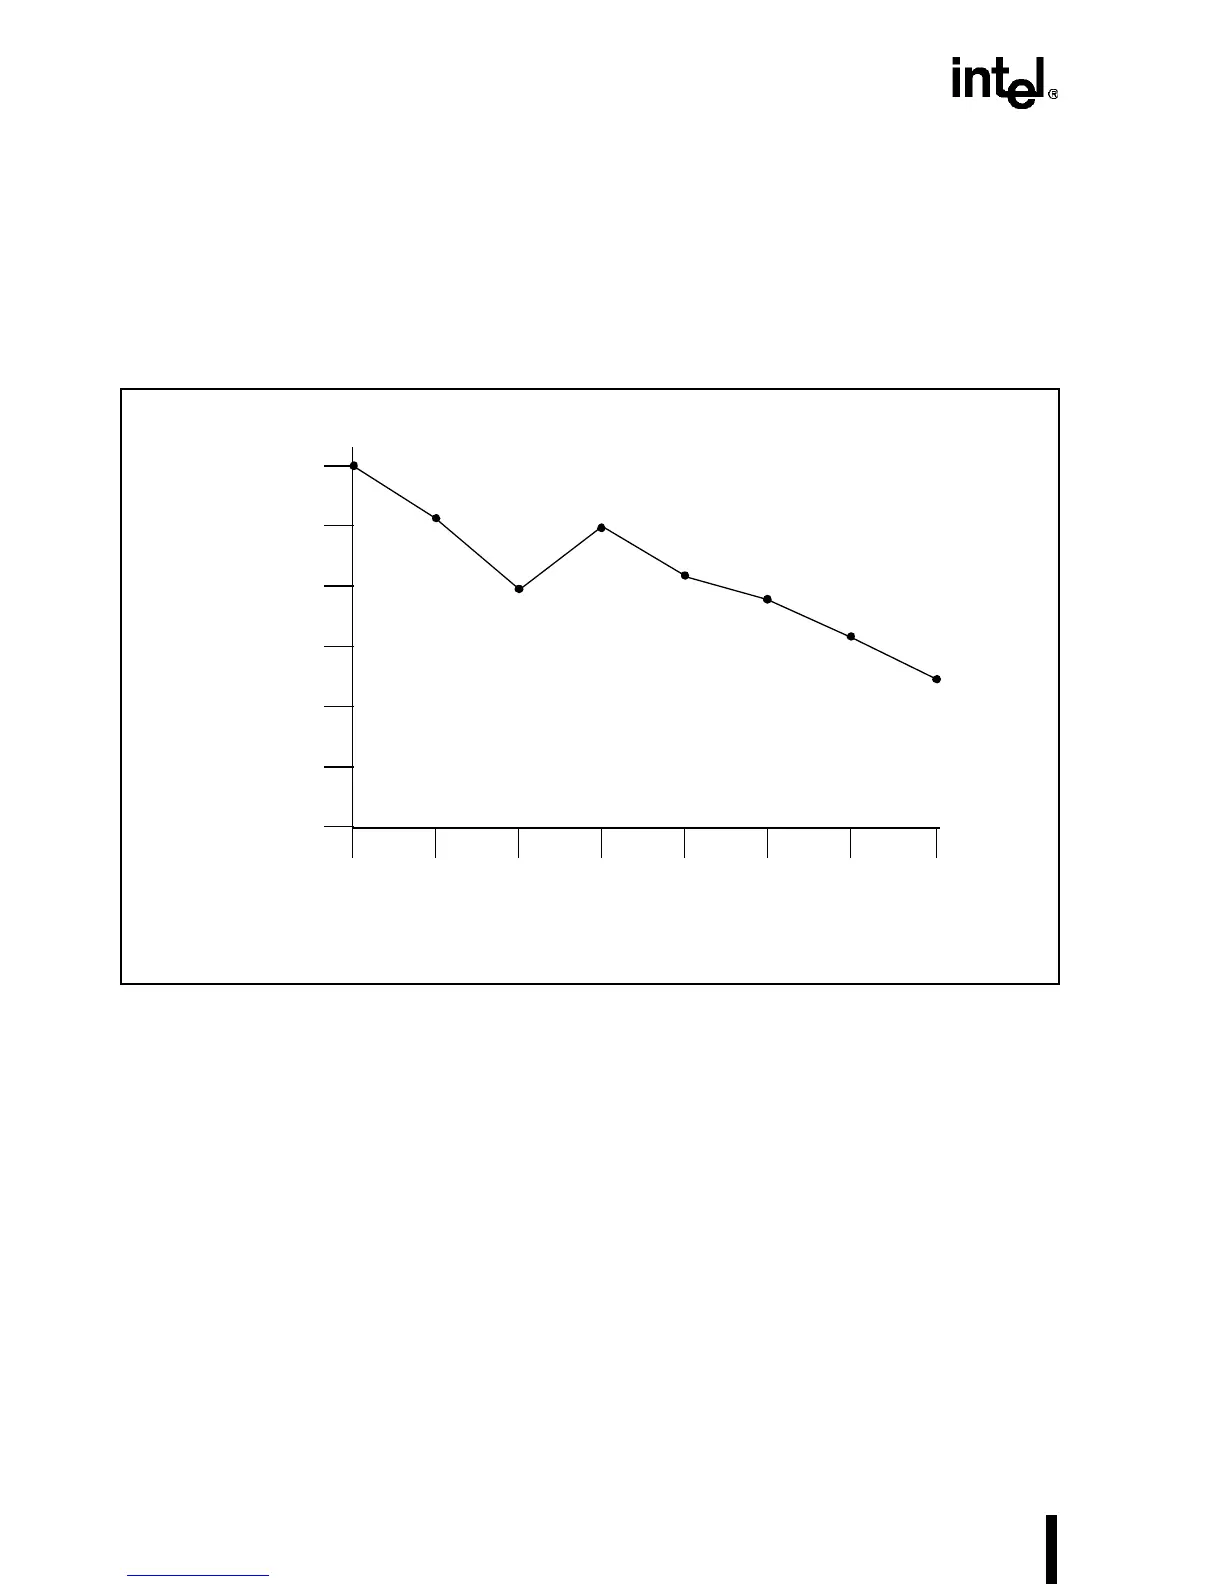
9.5.3 Impact of Wait States on Performance
There are many benchmarks used to evaluate the performance of microprocessor systems. Figure
9-3 demonstrates the performance of Intel486 processor systems using different bus cycle imple-
mentations. The 100 percent performance level is an Intel486 processor with an external memory
that operates a 2-1-2 cycle. The 2-1-2 cycle achieves the highest level of performance while a 5-
1-4 cycle achieves the lowest.
Figure 9-3. Effect of Wait States on Performance
Note that the performance effect of the four on-chip write buffers is apparent. Since more than
75% of external cycles are writes, write latency due to slower external memory should impact
overall performance more than read latency. However, the on-chip write buffers reduce the de-
pendence on write latency.
9.5.4 Bus Utilization and Wait States
Figure 9-4 demonstrates external bus utilization versus systems with different wait state config-
urations. The percentage figures were calculated by dividing the number of bus cycles in which
the processor required the bus by the total number of bus cycles. A smaller percentage is better
because it indicates that the external bus is accessed less frequently. In the benchmarks used in
this demonstration, the percentages varied from 39 percent for a 2-1-2 cycle system to 90 percent
for a 5-1-4 cycle system.
2-1-2 3-1-2 4-1-2 2-1-3 3-1-3 2-2-2 4-1-4 5-1-4
75%
80%
85%
90%
95%
100%
Memory Latency
Execution Rate (normalized)
Intel486™ Processor Performance vs. Memory Latency