Chapter 10. Generating Reports
Kaye Validator AVS User’s Manual 116
10.6 The Performance Analysis Screen
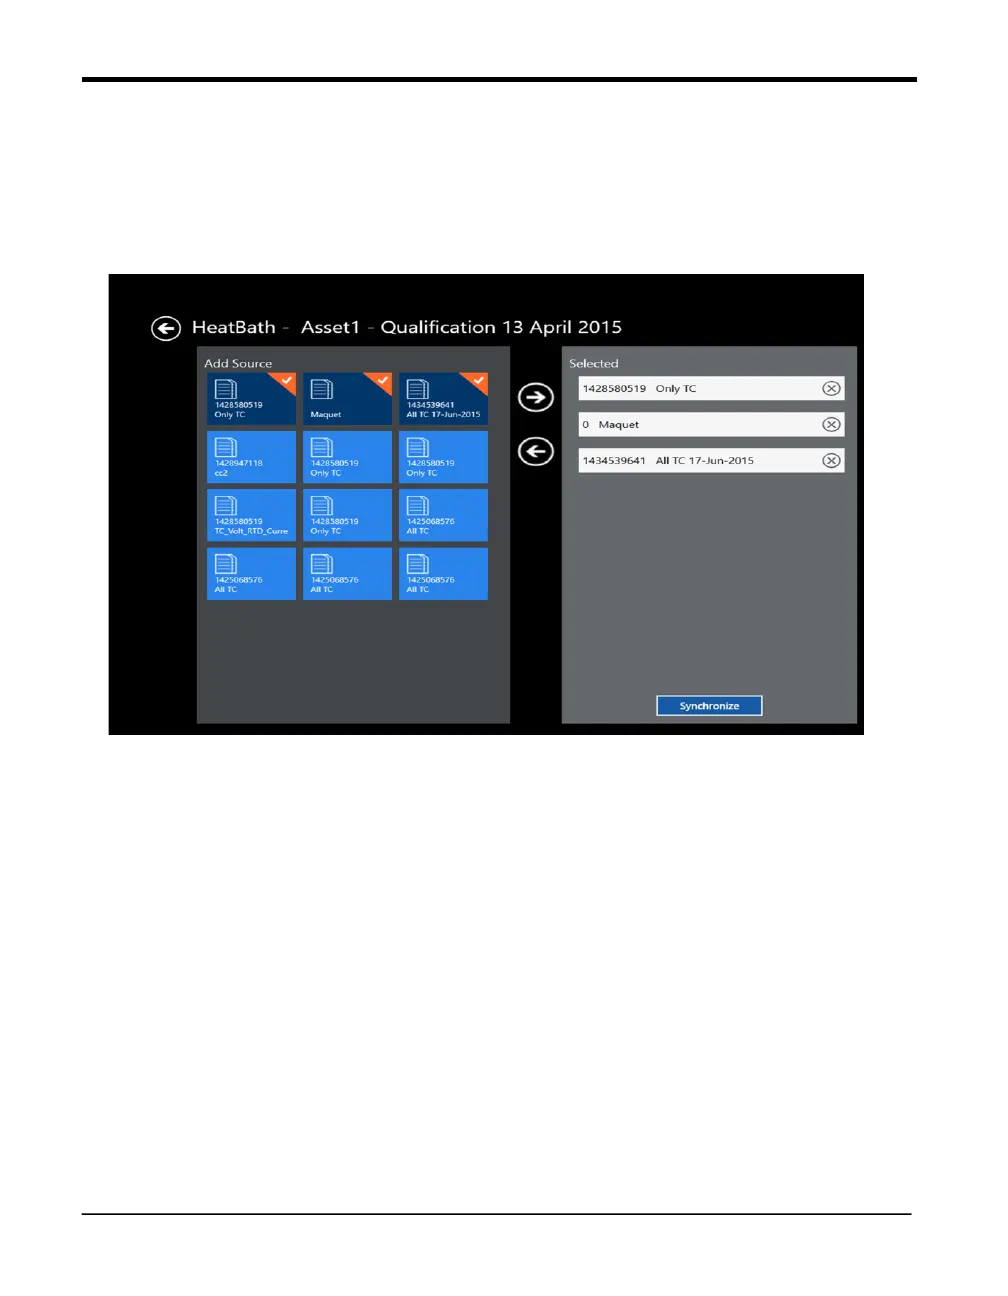
Figure 72: The Data Sources Screen
If user selects Advanced Analytics Option in Report Analysis Screen then from there it
will be navigated to Report Detail Screen. In Report Detail Screen after selecting
particular file data sources screen appears. If you highlight a study file and touch the
forward (right) arrow, the file moves to the right panel, which displays the setup files
selected for the report. (To remove the file from the report, touch the backward (left)
arrow.) The selected files are highlighted in a mix of dark blue and orange on the left,
while the unselected files appear in light blue. You can add up to three qualification study
files. (A warning appears if you try to add a fourth study.) When you select two or three
studies, the Synchronize button appears at the bottom of the right panel. If you press
Synchronize, the data of the merged files appears in graph form in a sequence.
When you press Data Sources, the screen displays two panels. The left panel, Add
Source, with a More button that displays all other study files.