Chapter 9. The Qualification Study
Kaye Validator AVS User’s Manual 100
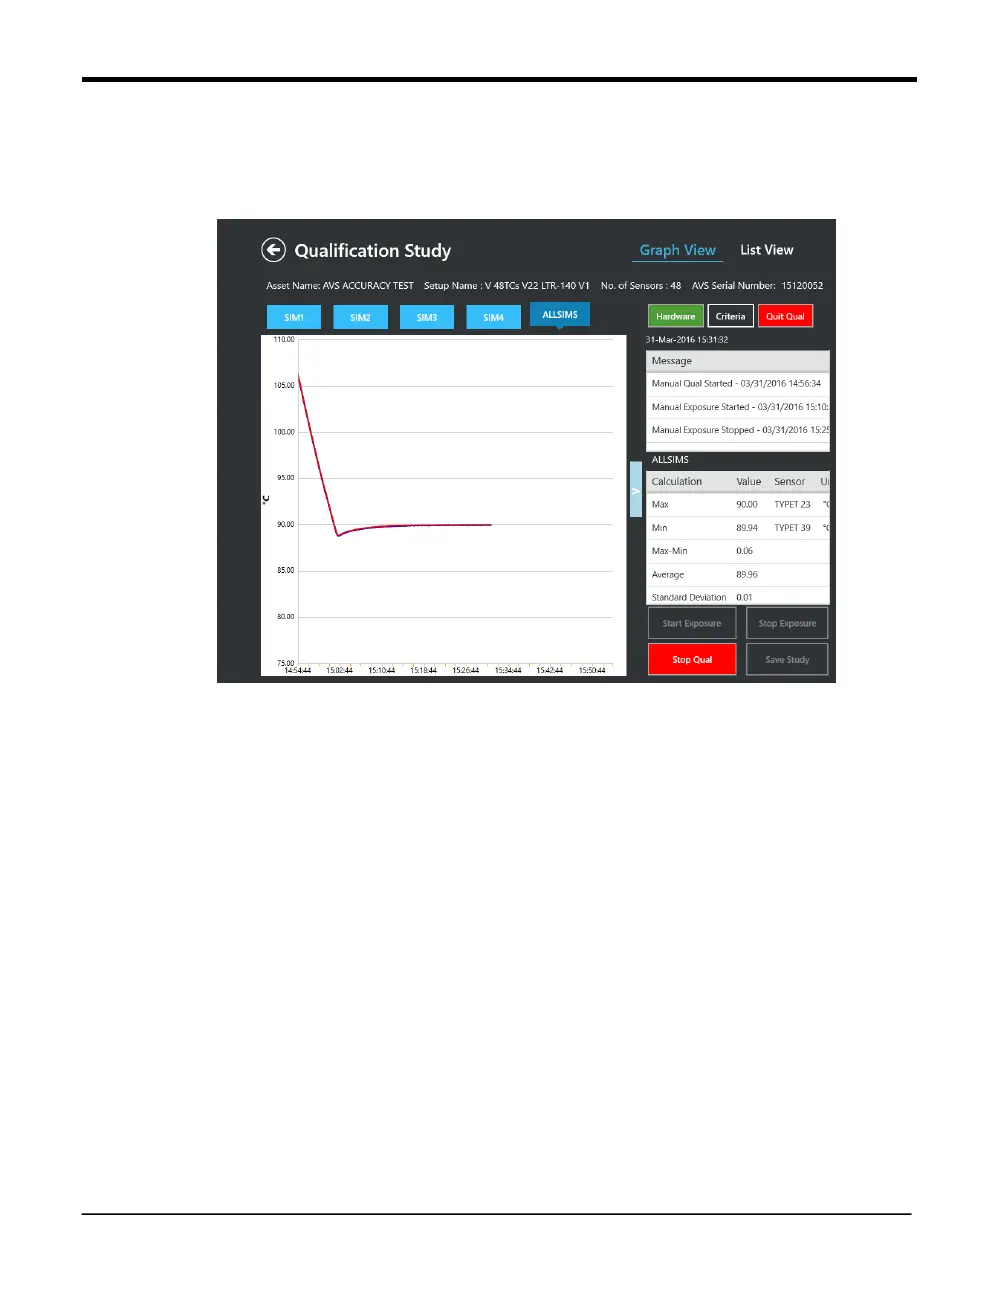
9.4 Graph Real-Time Sensor Readings and Calculations
Figure 64: Graphing Sensor Readings
During the qualification data samples are displayed as per display rate.
To graph real-time sensor readings and calculations:
1. Press the Graph View option.
The Graphs screen displays.
All the available Groups in that particular setup are displayed, when pressing the button for
each group, the corresponding graph is displayed.