Chapter 7. Calibrating and Verifying Sensors
Kaye Validator AVS User’s Manual 84
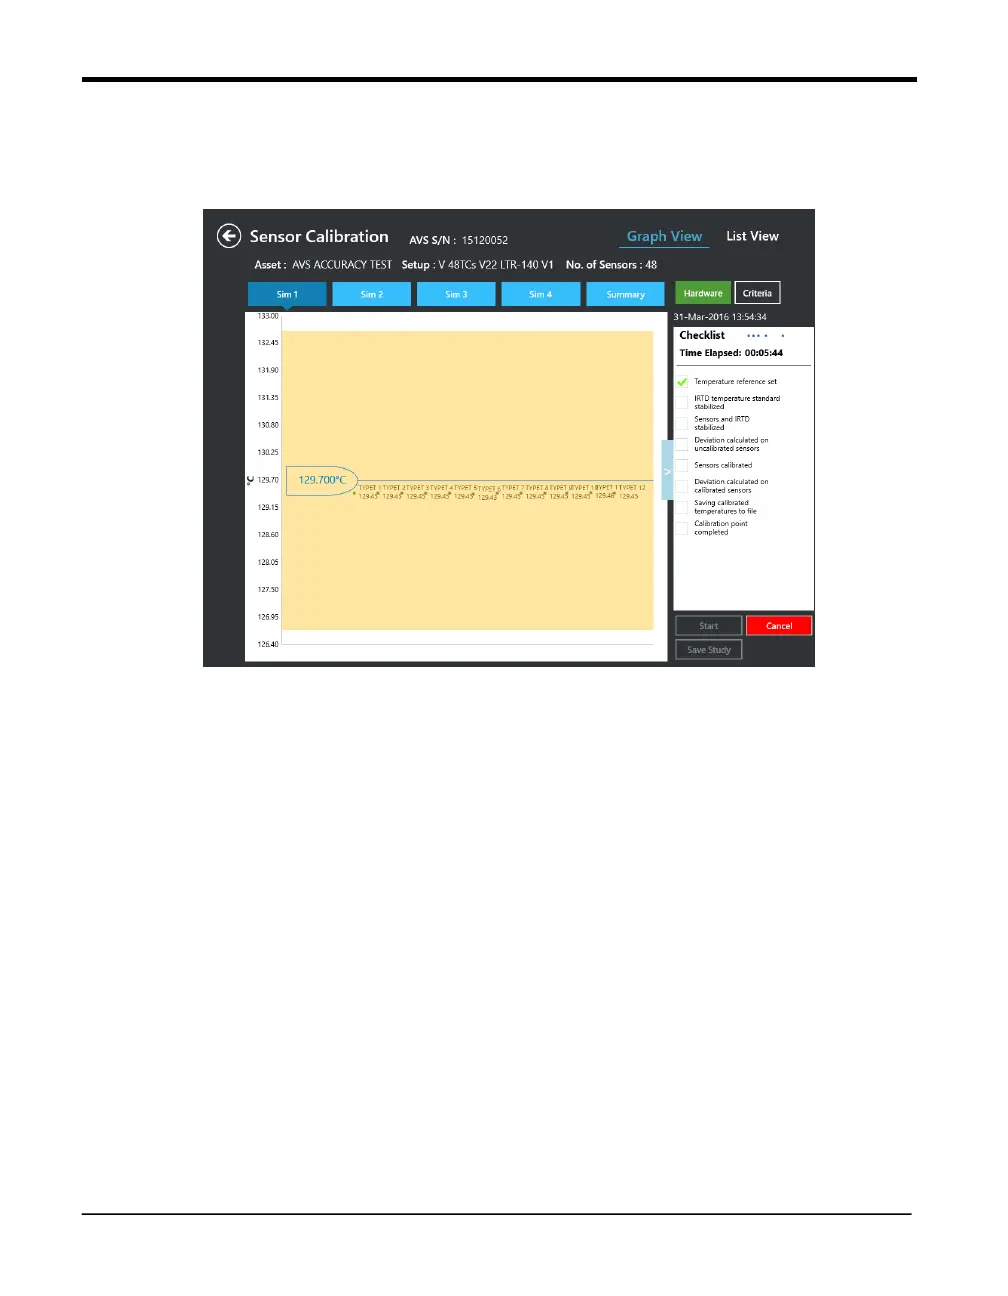
7.4.6 The Graph View
In the calibration study Graph View, the header consists of icons representing four SIMs,
along with a summary. A drop-down list below these icons displays the setpoint
Figure 49: Calibration Study -- Graph View
On the graph, the temperature appears on the Y axis, while the highlighted X axis shows the
stabilized IRTD temperature. All the sample points that lie within the deviation specified are
displayed in green dots along with the label and the temperature point of the sensor. All the
samples that deviated from the specification are displayed in red dots along with the label of the
sensor, the temperature point of the sensor and the value that indicates how much the sensor is
off.
On the summary tab, the outliers of all the SIM are displayed, along with the SIM number,
sensor label, the temperature point of the sensor and the value of how much the sensor is off.
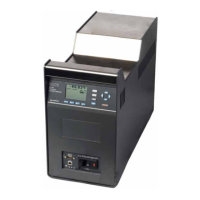
7.5 Current Calibration and Hardware Connections
Both List and Graph views display essential data:
Bath serial number
Hardware Connection status