9 Visualization
Maschinenfabrik Reinhausen GmbH 2020 2536385142/08 EN ETOS
®
ED
Note that, for measured values via analog input signals (e.g. temperature),
a maximum of 100,000 measured values with an average value interval of
3,600 s (= 1 h) will be saved. This is equivalent to a time period of approx.
11 years.
Mean value interval 360s
Figure175: Recorder
1. Go to Settings > Parameters > System > Recorder.
2. Select the desired parameter.
3. Set the parameter.
4. Press the Accept button to save the modified parameter.
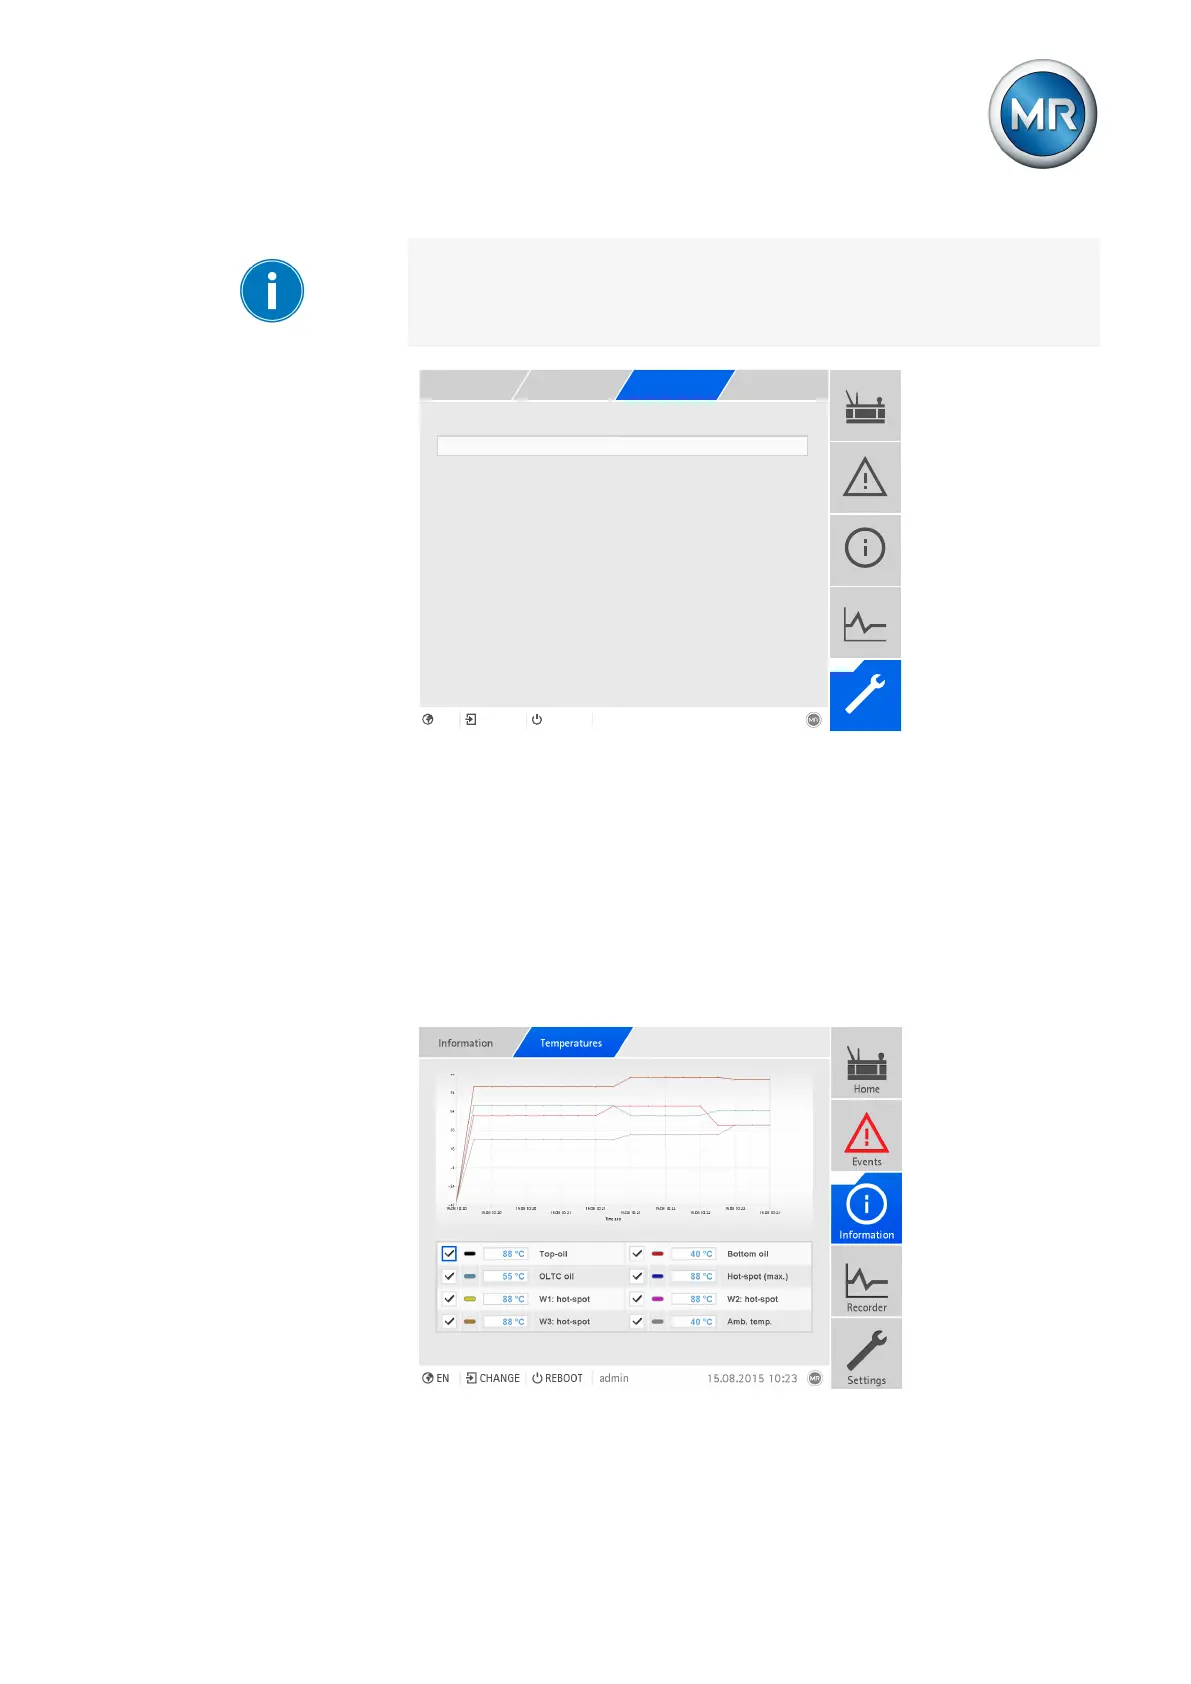
9.24.4 Displaying temperature curve (optional)
You can display the temporal progression of the temperatures measured
over the last 10 days.
Figure176: Temperature curve
► Go to Information > Active part > Temperatures.