9 Visualization
Maschinenfabrik Reinhausen GmbH 2020254 6385142/08 ENETOS
®
ED
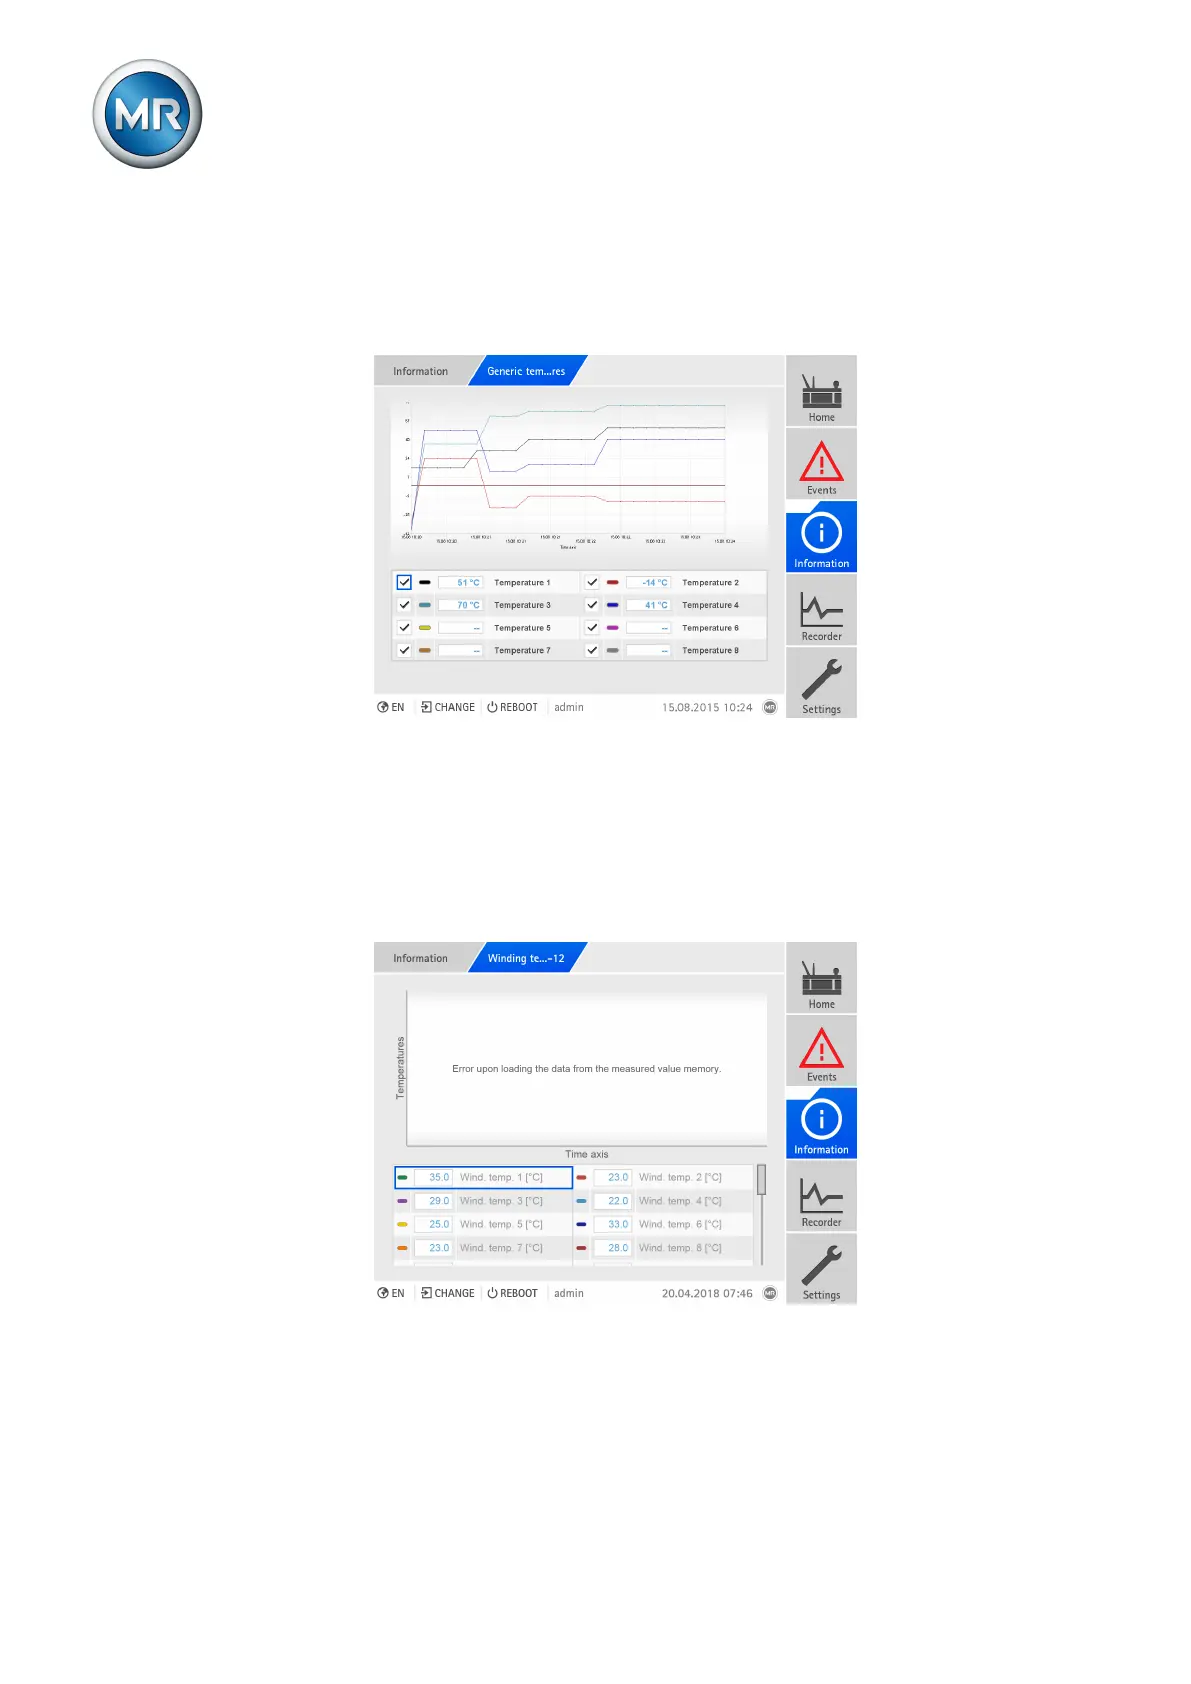
Generic temperatures
If you are using additional temperature sensors (generic temperature 1...8),
you can display the temperature curve for these temperatures over the last
10 days.
Figure177: Generic temperatures
► Go to Information > System > Gener. temperatures.
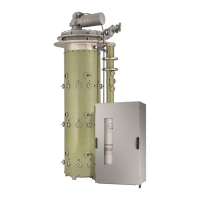
9.24.5 Displaying winding temperatures (optional)
If you record the winding temperatures with a sensor, you can display the
temporal progression of the measured winding temperatures over the last 10
days. To do so, proceed as follows:
Figure178: Winding temperature
► Go to Information > Active part > Winding temperature 1-12/13-24.
As an option, you can also display the measured value trend over a time pe-
riod that you define (max. the last 10 days). You will find more information on
this in the section "Measured value recorder" [►Section 9.24.2, Page 248].