7088-8000
-174
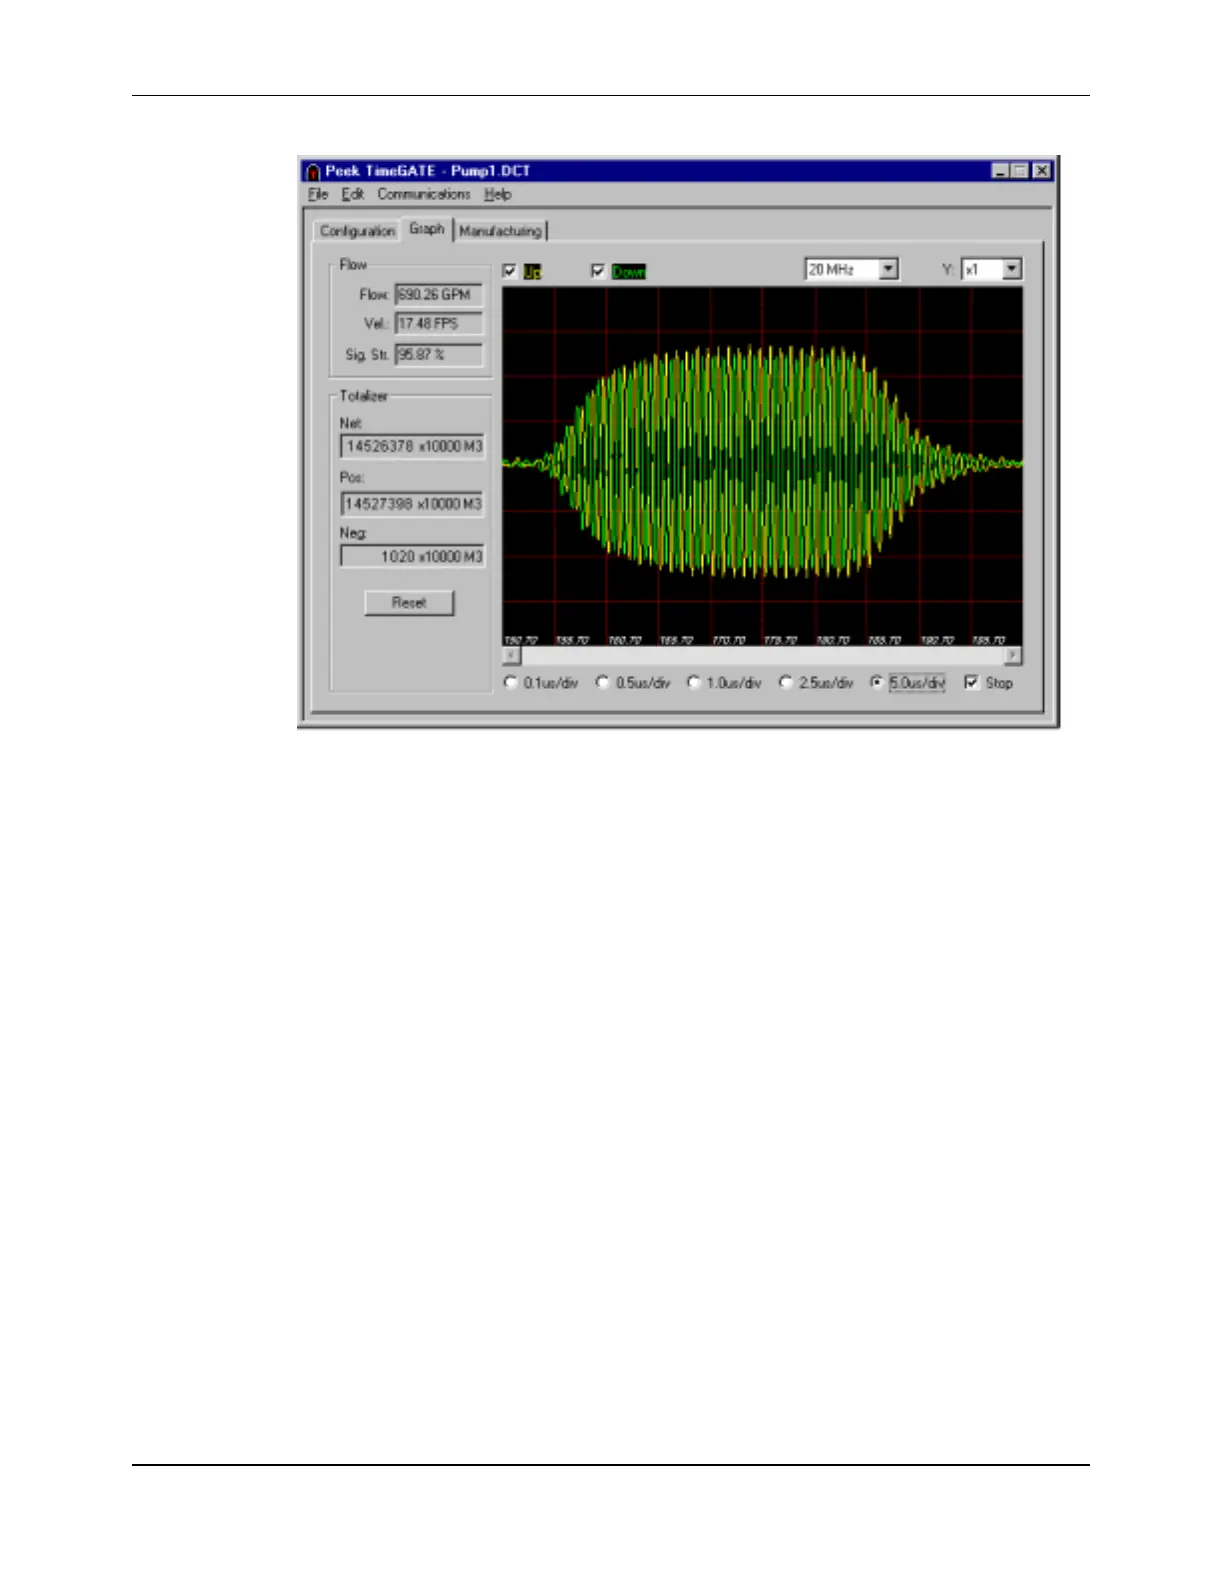
Figure F-23 Graph with 5.0 Microseconds per Division (example)
The Y axis can also be displayed with one of several scaling factors.
To select a scale for the Y axis, click on the down arrow to the right of the
Y
text box
(located in the upper right corner of the graph) and click on one of the following Y scaling
factors:
!
x1
!
x2
!
x4
For further analysis of a particular signal sample, the image can be “frozen” on the graph
before the sample is updated by clicking the
STOP
check box in the lower right corner.
NOTE:
The
RESET
button on the
GRAPH
tab is used for resetting the totalizers.