RADWIN2000CPlusUserManual Release3.5.70 19‐6
RunningSpectrumView Chapter19
IfitisacceptabletodroptheserviceclickYes.Theprocessingmayappeartohavestopped‐
butitisnotcompleteuntilalloftheShowbuttonsforlinkareenabled.
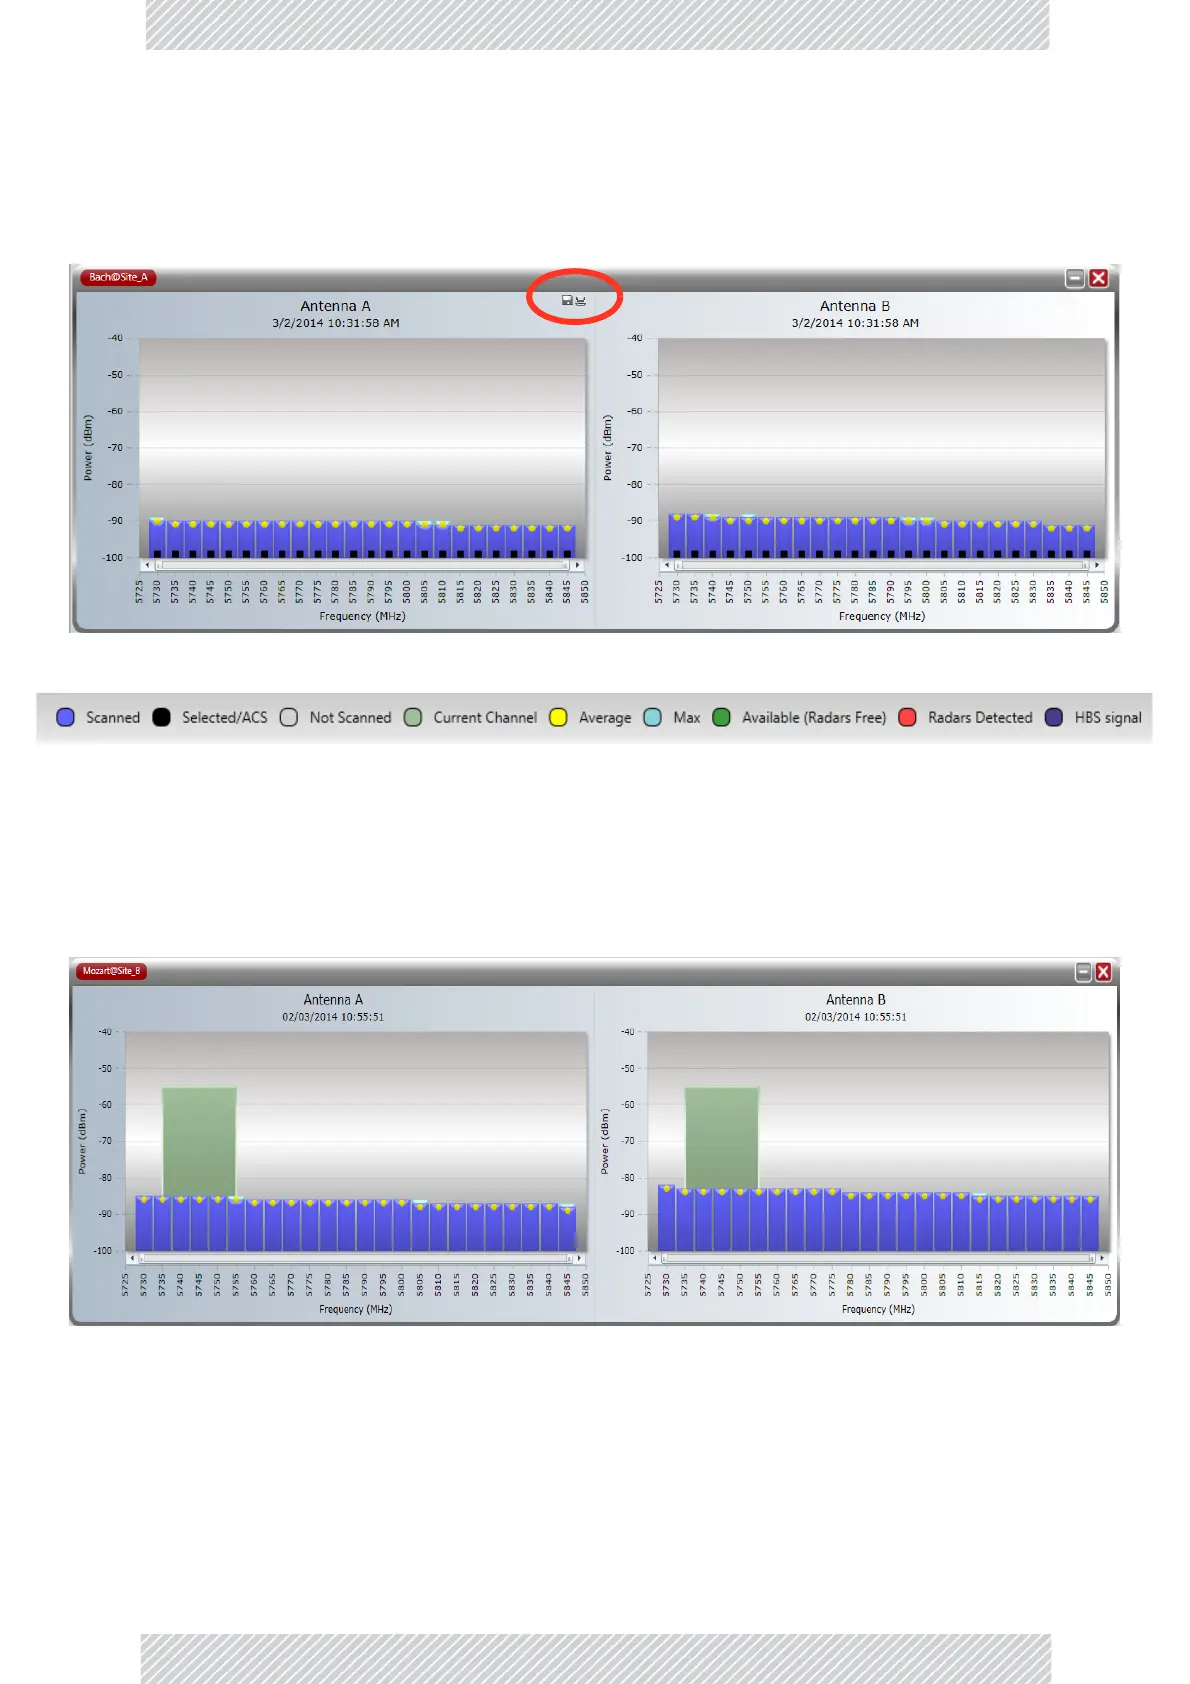
HereistheresultfortheMaster:
Thek eystothecolorcodingispermanentlydisplayedatthebottomofthemainwindow:
Figure19‐1:SpectrumViewAnalysiscolorcodes
ThegreenbandreflectsthecurrentMasteroperatingfrequency.Noticealsothesmallfly‐
overdisketteicon(circled)totheupperleftofeithergraph.ClickingitopensaWindowsFile‐
Savedialogallowingyoutosavethegraphtodiskasajpgfile.
HereistheanalysisforSlave.Itisabitdifferent:
Thelightgreenrectangleinthebackgroundofbothantennadisplaysreflectsactualchannel
(20MHzwidehere)beingusedbytheSlave.ThetitlebaralsocontainstheSlave ’sIPaddress.



 To Next Page