Instrument Functions
R&S
®
NRP2
125User Manual 1173.9157.02 ─ 03
Marker1 Pos (▼) / Marker2 Pos (▲)
Defines the positions of marker 1 and 2. The positions are referenced to the delayed
trigger event.
4.5.6 Pulse display mode
The R&S NRP2 performs automatic analysis of pulsed signals (with wideband power
sensor R&S NRP-Z-Z8x only). The measurement is either performed over the visible
portion of the trace (entire screen width), or within the active gate of the selected trace
(waveform). The measurement results are shown in the info panel at the bottom of the
screen. The settings for "Trig"gering, "Filt"ering, "Function", and "Unit" are taken from the
"Trace" display mode and cannot be changed.
►
Select "Pulse" in the control panel opened via the Window→Graph→"Display" dialog
box ("Trace&Statistics" sensor mode).
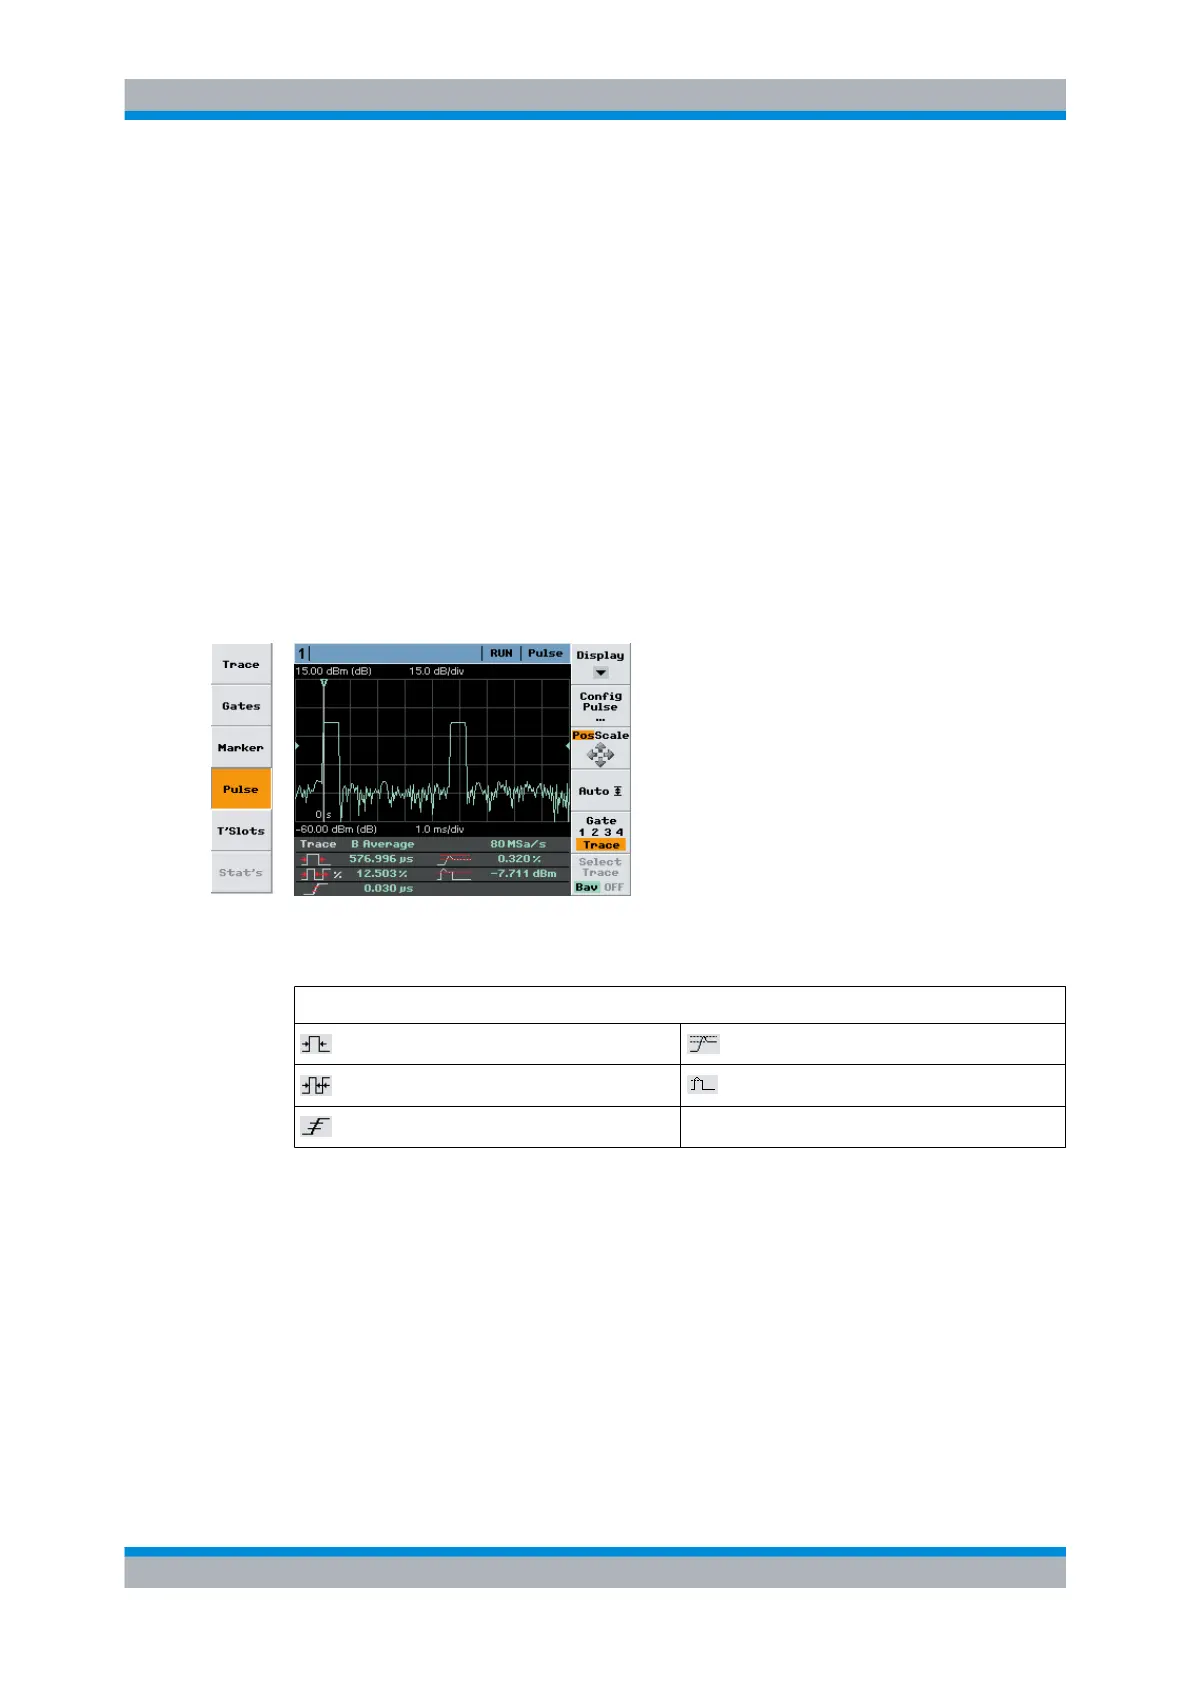
Fig. 4-54: Pulse display mode
Table 4-9: Legend of info panel:
Gate/Trace, analysis window, channel, display type; effective sampling rate
: pulse width : positive overshoot
: duty cycle
: pulse top power
: rise time
An active gate is indicated by colored lines, as shown in the graph.
The info panel in the pulse trace diagram indicates up to 6 parameters. The values to be
indicated can be selected in the "Pulse Measurements" dialog box, see chapter 4.5.6.2,
"Pulse diagram settings", on page 127. For a complete list of pulse symbols see table
3-2Symbols for pulse parameters, page 59.
Displaying traces