Display
R&S
®
RTM20xx
62User Manual 1317.4726.02 ─ 01
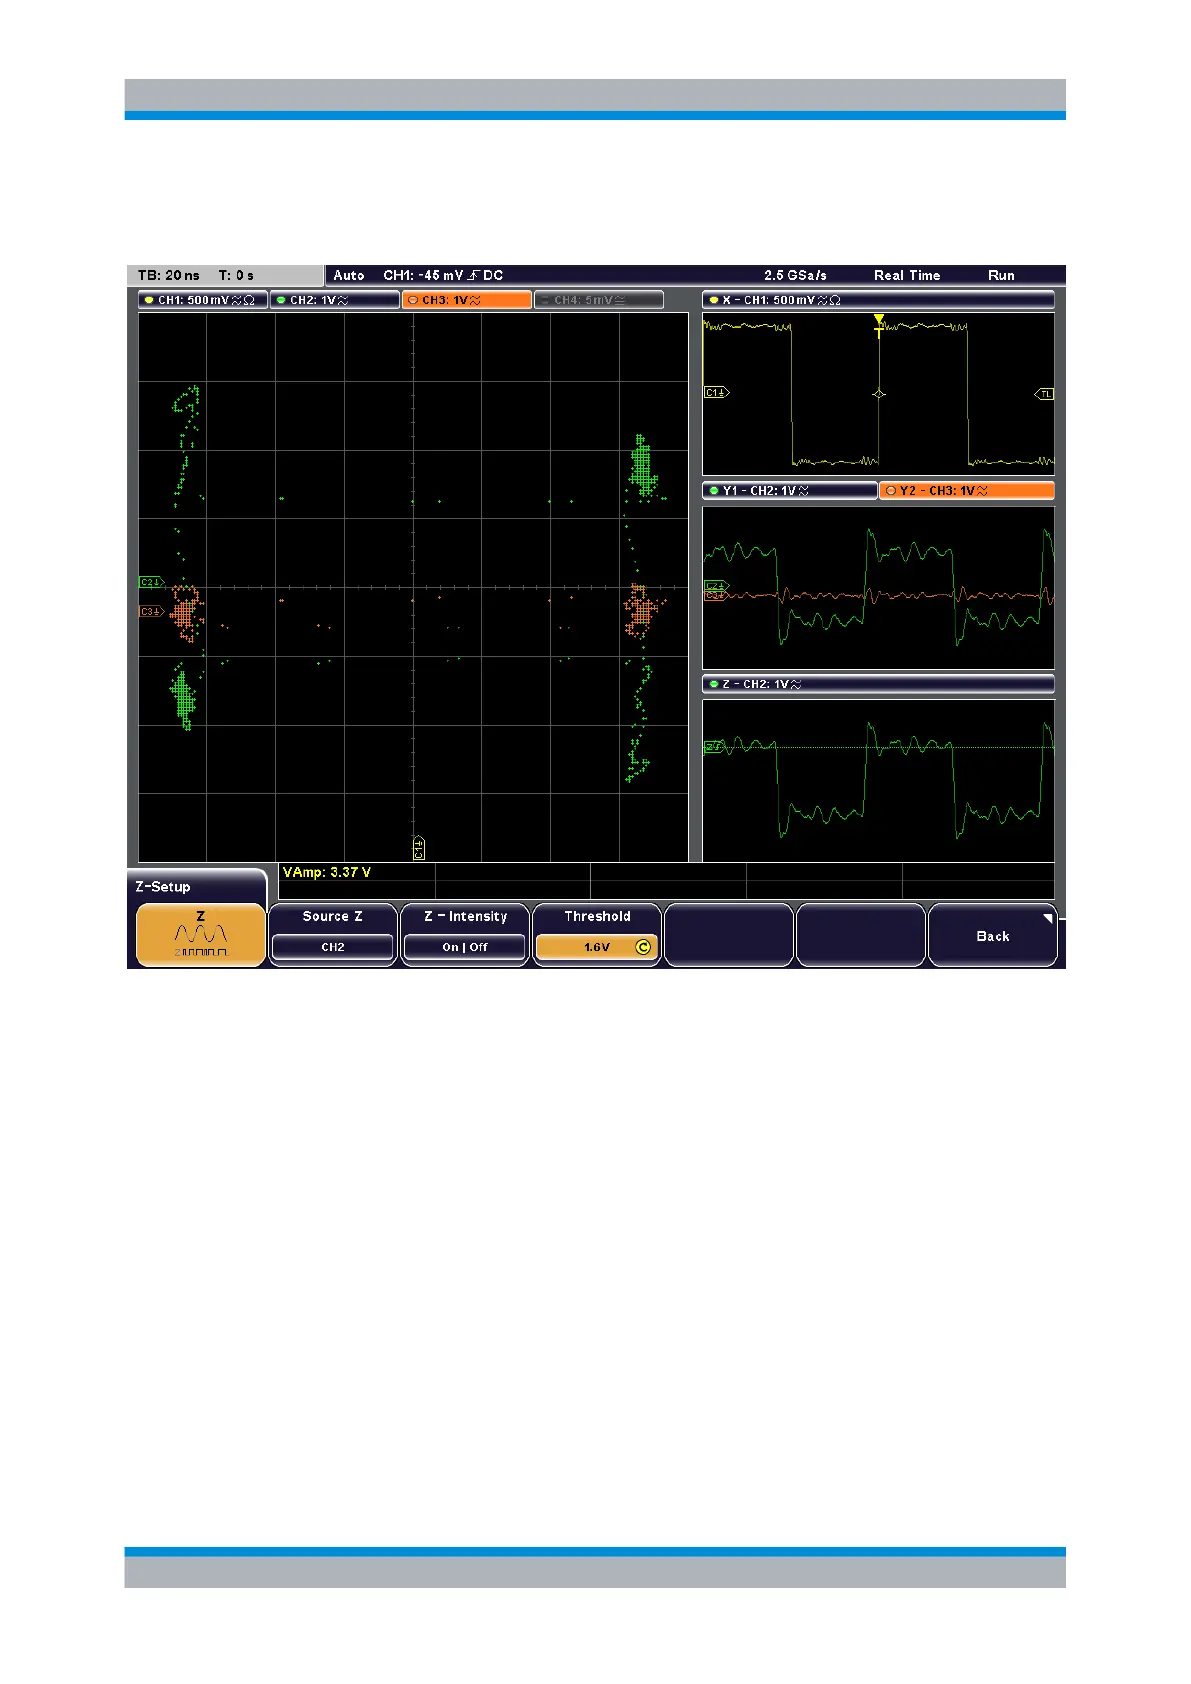
Together with the XY-diagram, the time diagrams of the source signals are displayed in
separate windows.
Fig. 4-1: XYZ-display
4.2.1 Configuring XY-Diagrams
XY-diagrams combine the voltage levels of two waveforms in one diagram. A further
signal source can be used to determine the intensity of the XY-waveform.
4.2.1.1 Setting Up the XY-Diagram
To switch the display to XY-diagram and vice versa
► Press "DISPLAY > Display Mode" until the "XY" mode is selected.
XY-Diagram

 Loading...


