10.7 2D
Information about the exorotation and subtalar joint angles is available in the
Clinical, Scientific package(s).
The 2D analysis replays the roll-offs of the current foot selection.
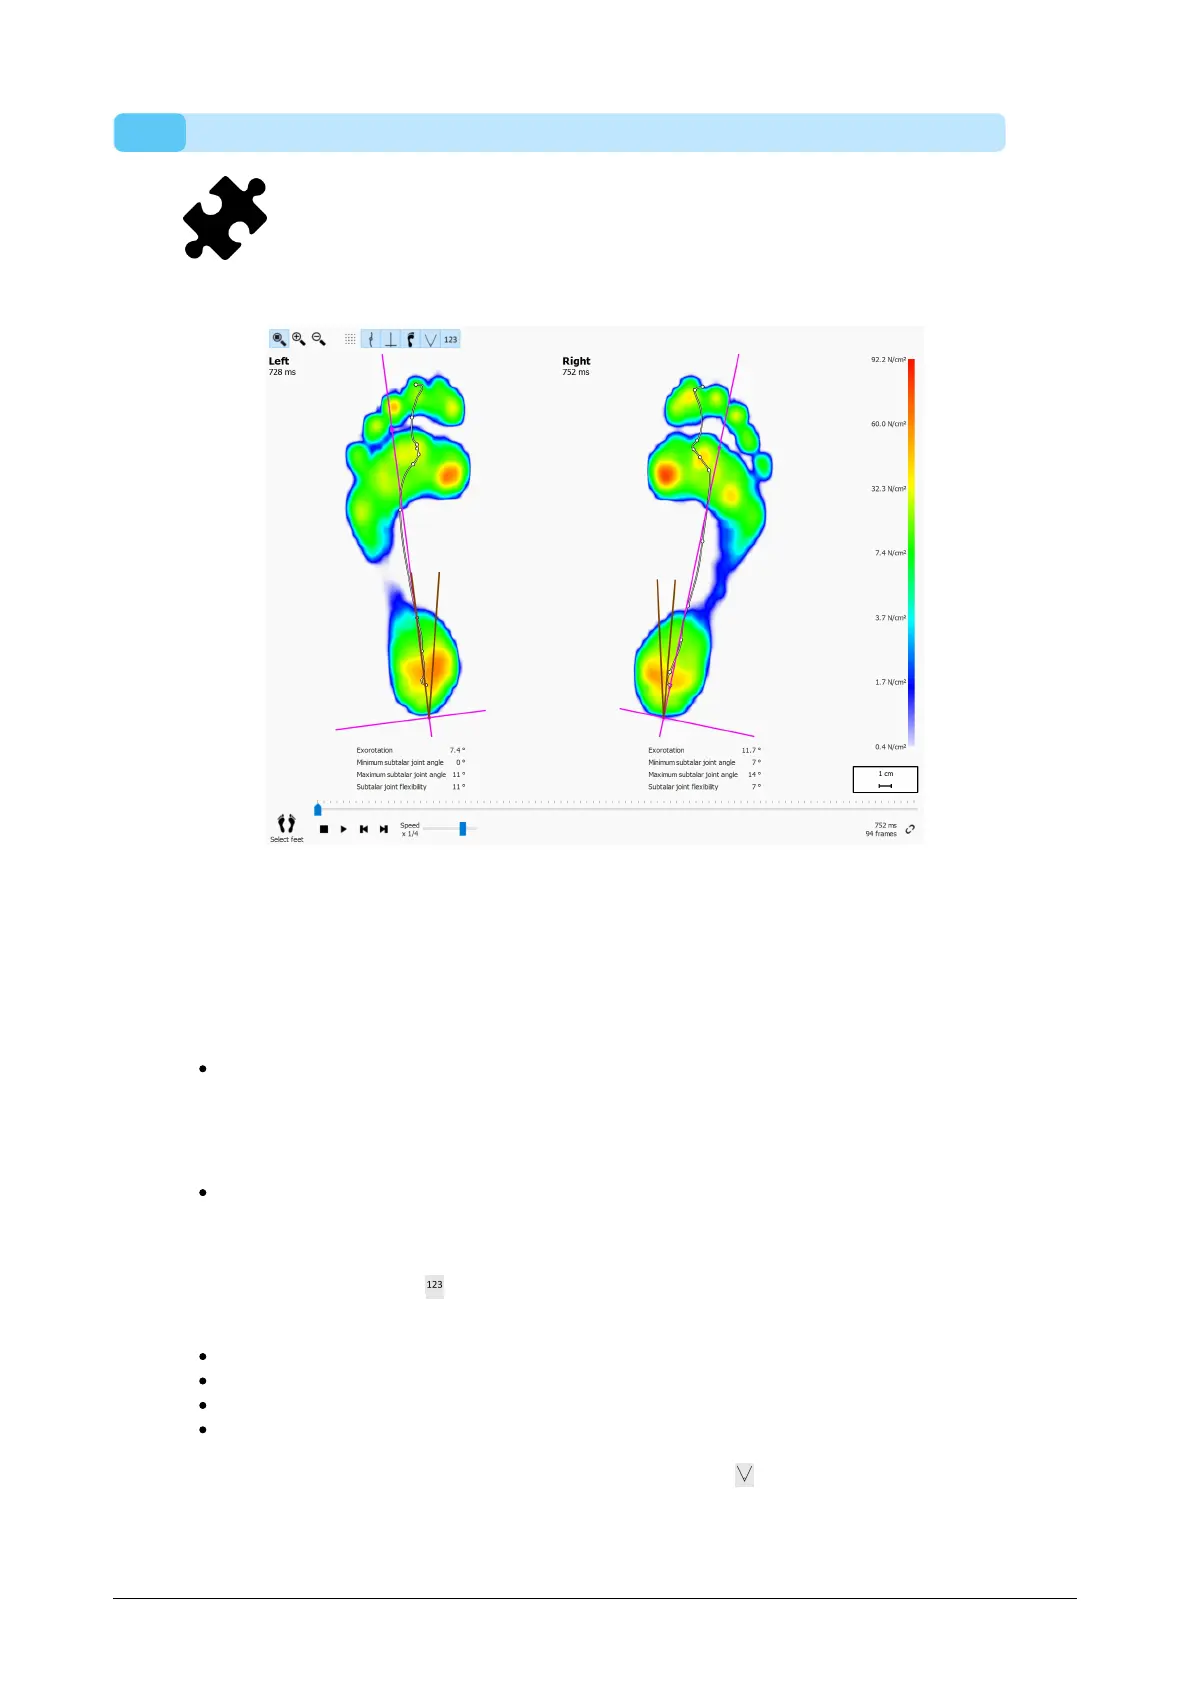
Figure 44: The 2D analysis replays the roll-offs of the current pair of selected feet.
The 2D analysis shows the current pair of selected feet. The dotted line represents the
center-of-pressure of the roll-off. The pink line shows the foot axis connecting the
middle of the medial and lateral heel with the middle of metatarsal heads two and three.
The Clinical, Scientific package(s) provide information about the subtalar joint angles
and subtalar joint flexibility:
Subtalar joint angle: provides for an indication of the amount of frontal plane
rearfoot motion in relation to the ground during the initial contact phase. A higher
value for the subtalar joint angle suggests a more pronated rearfoot. The minimum
and maximum values indicate the maximal supination and maximal pronation
position of the rearfoot in relationship to the ground for the initial contact phase.
Subtalar joint flexibility: the range between the minimum and maximum subtalar
joint angle.
Information about the foot axis exorotation and the subtalar joint angles can be
displayed by toggling the toolbar button, the following numerical information is
shown:
the exorotation of the foot axis in degrees
the minimum subtalar joint angles in degrees
the maximum subtalar joint angles in degrees
the subtalar joint flexibility in degrees
The subtalar joint angles can be visualised by toggling the toolbar button. The brown
lines show the minimum and maximum subtalar joint angles. During replay, the red line
will show the current subtalar joint angle.