10.3 Static
The Static analysis (Figure 40) shows the relative force distribution of the static
measurement.
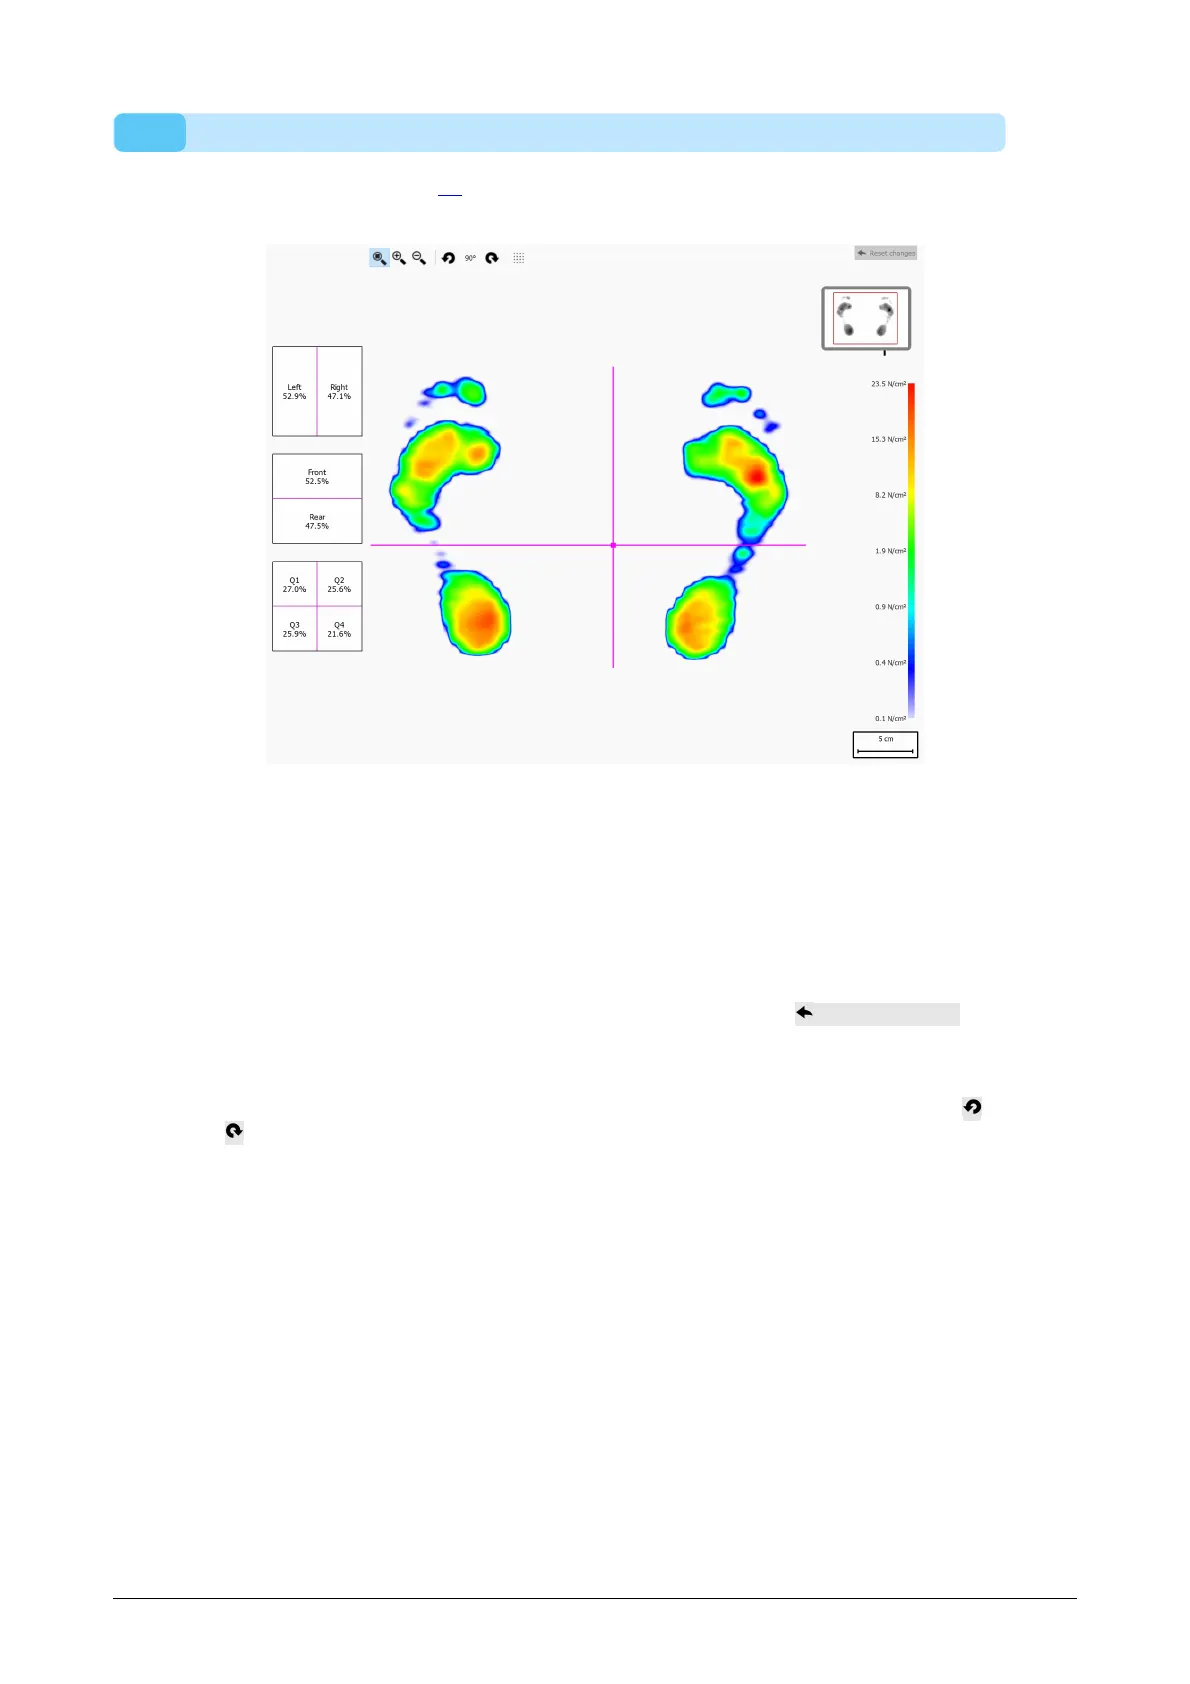
Figure 40: The Static analysis shows the relative pressure distribution of the static
measurement. The percentages in the boxes show the spread of the total force on the
footscan plate across the quadrants.
The analysis divides the static measurement into four quadrants, marked by pink lines.
The center of these quadrants indicates the center-of-pressure of the measurement.
The percentages in the boxes on the left express how the pressure on the footscan
plate is spread across the different areas defined by the quadrants.
Drag the center and/or lines to modify the relative positions of the quadrants. The
analysis updates the percentages in the boxes accordingly. Click Reset changes to
reset the changes.
The plate miniature at the top right shows the region of the plate currently displayed by
the static analysis. Zooming in and out updates the miniature instantaneously. Use
and in the toolbar to modify the orientation of the plate.
®
®