10.11 Probes
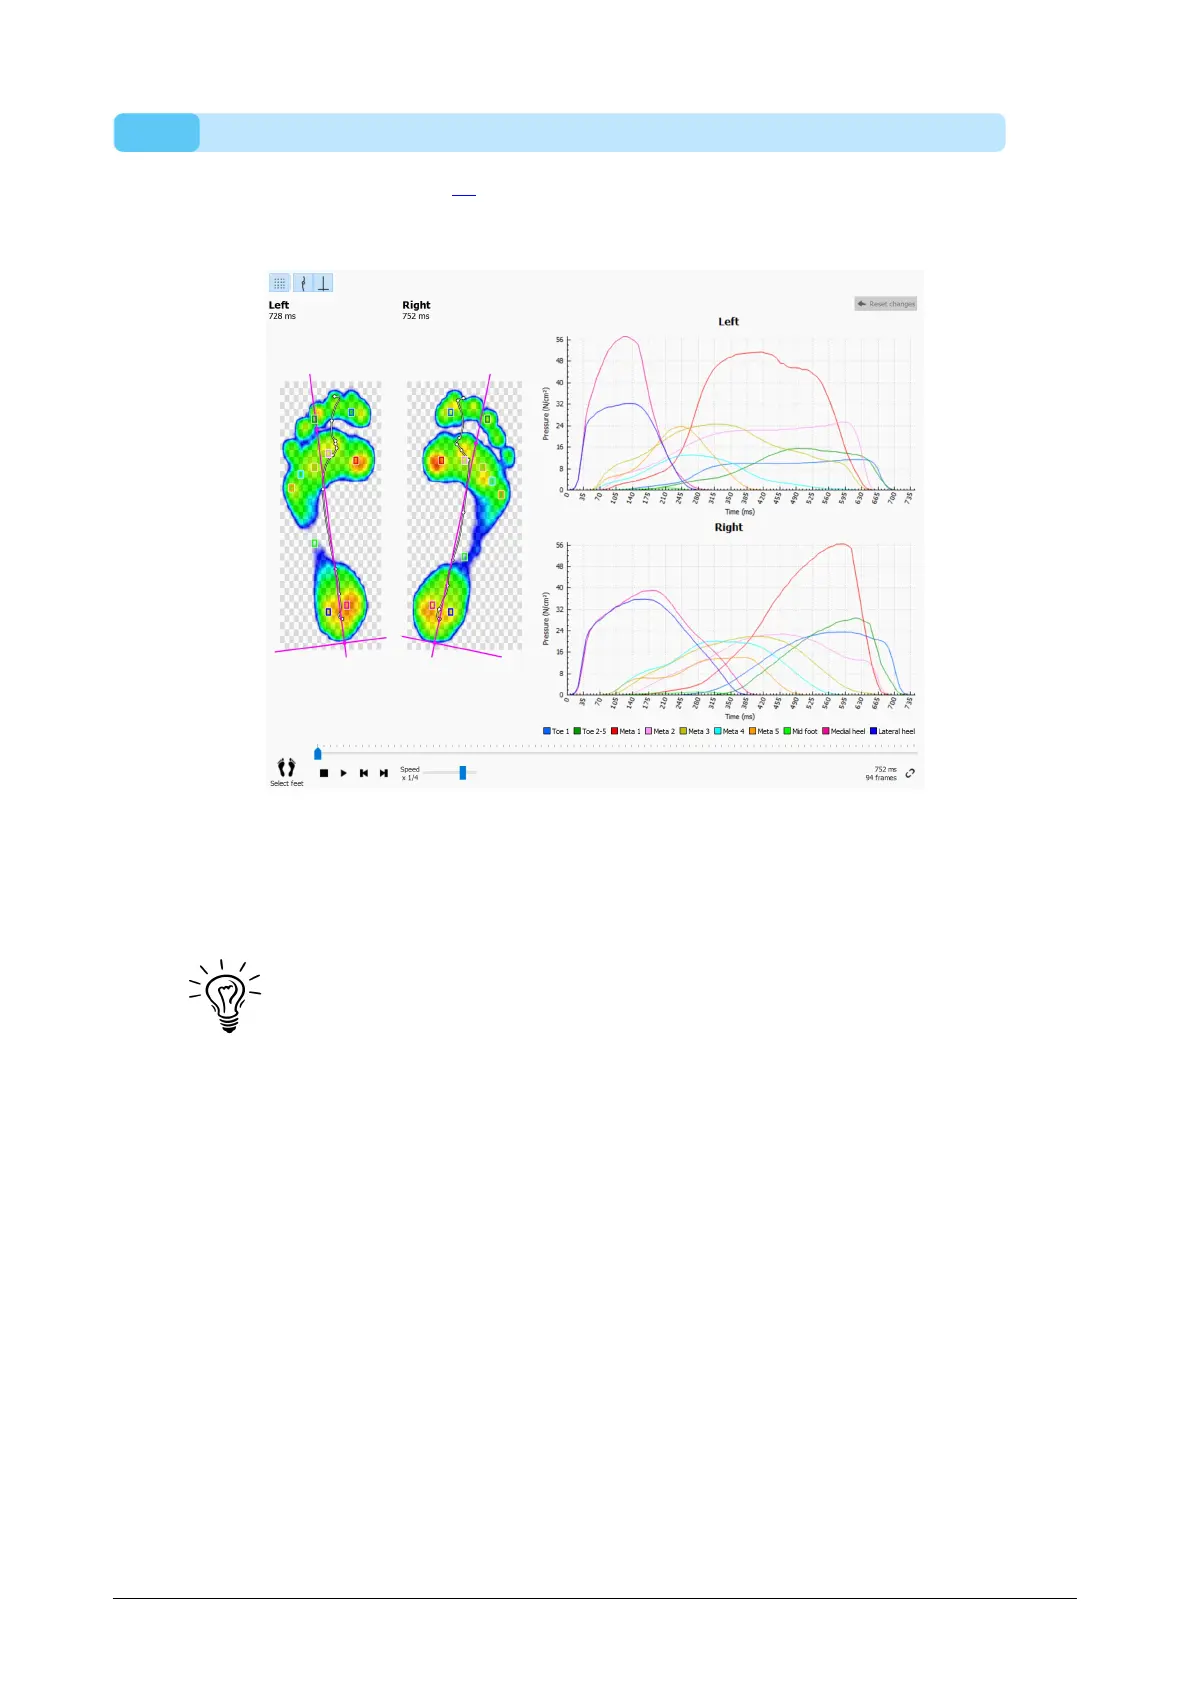
The Probes analysis (Figure 48) displays the pressure applied to ten user-defined
rectangular areas or probes of the current foot selection. Each probe represents a
pinpoint to the zone with identical color.
Figure 48: The Probes analysis plots the pressure on ten user-defined probes of the
current foot selection.
The Probes analysis plots the pressure for each probe in graphs next to the roll-offs of
the current foot selection. When played the graphs dispay vertical marker lines at the
current position in time.
Initially footscan 9 places each probe on the sensor at the center of its
corresponding zone. Click and drag any of the corners of a probe to resize it
in that direction. Click and drag the middle of the probe to reposition it. Note
that the application updates the graphs instantaneously when the probes
change.
®