10.4 Balance
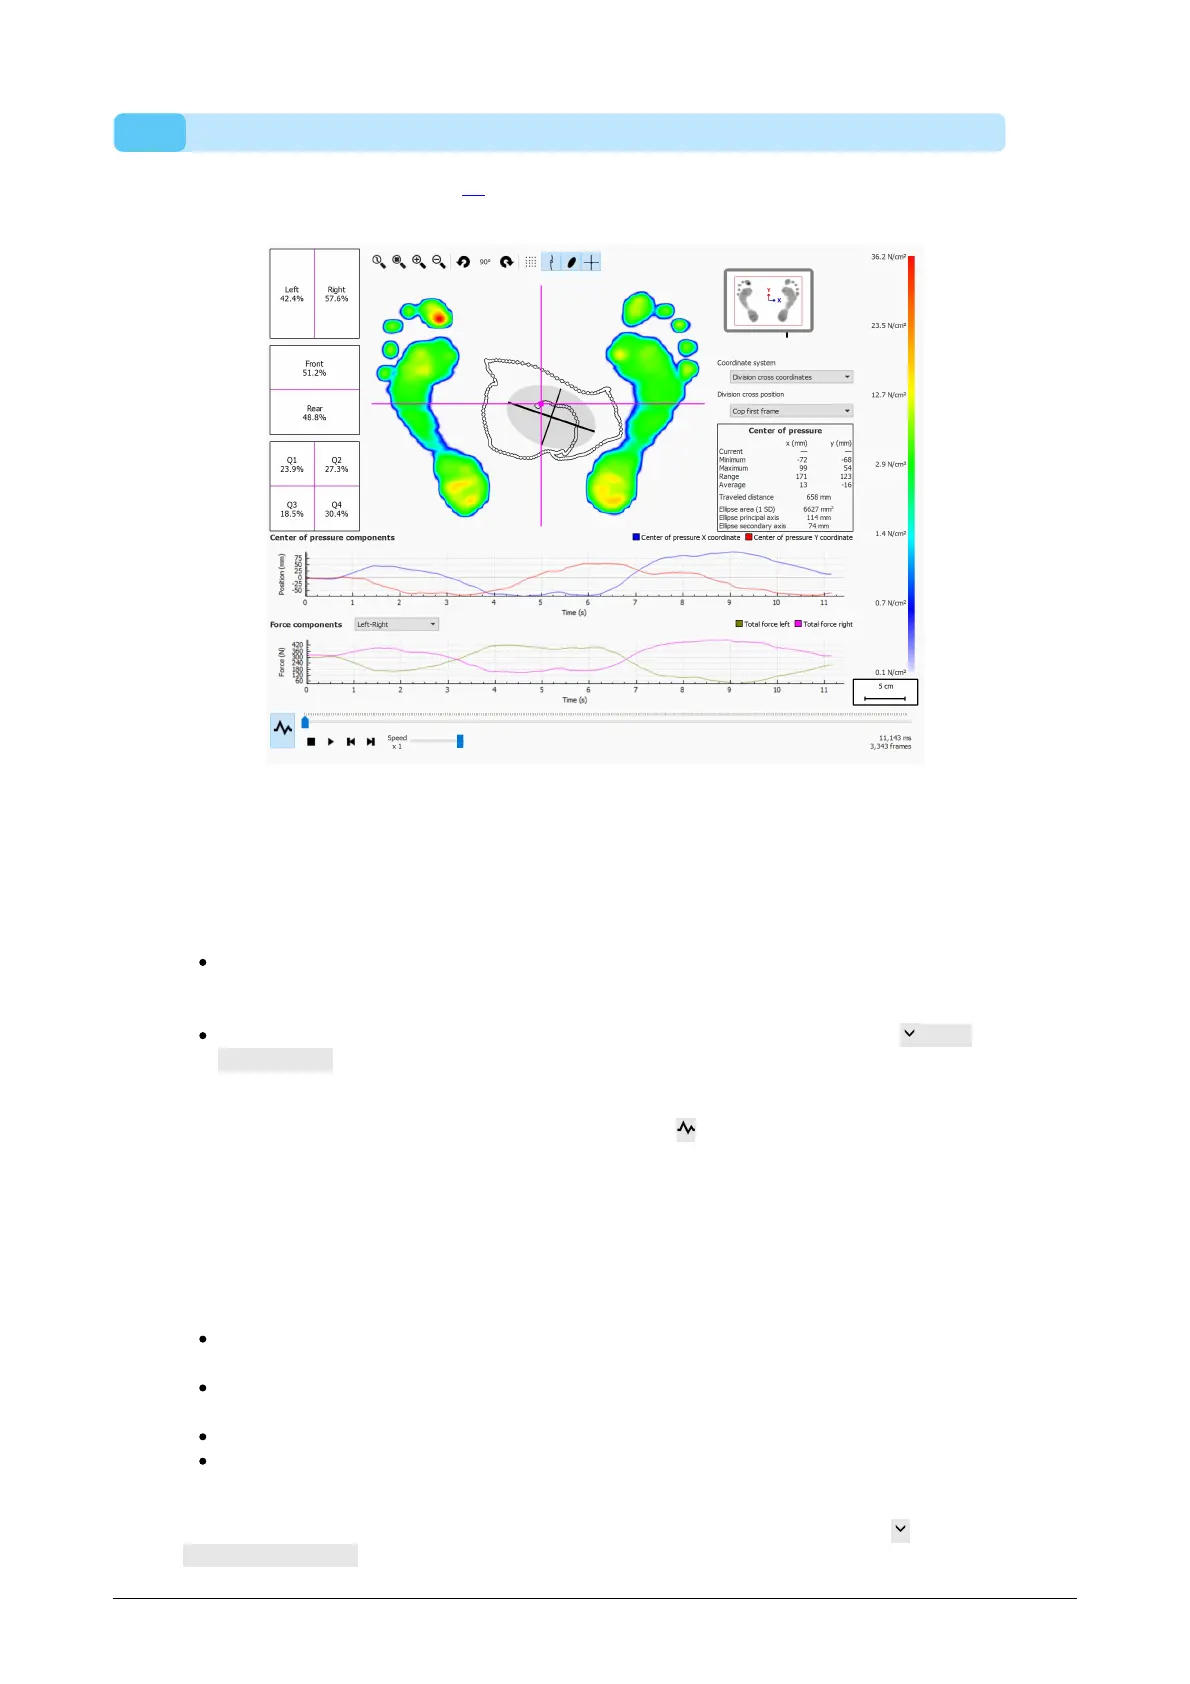
The Balance analysis (Figure 41) evaluates the pressure distribution and the
displacement of the center of pressure (COP) of a balance measurement.
Figure 41: The default balance analysis screen.
When playing, the balance analysis loops through the entire balance measurement.
When stopped it shows the maximum pressure values registered during the balance
measurement.
There are two graphs in the balance analysis screen:
Center of pressure graph: this graph shows the displacement of the center of
pressure in the x and y directions in millimeter. The x-axis shows the time in
seconds.
Force graph: this graph shows the total vertical force in Newton. Use the Force
components combobox to select which force components are shown. The x-axis
shows the time in seconds.
Both graphs can be hidden or shown by clicking the button.
The balance measurement is split into four quadrants. The division point of these
quadrants is marked by the point of intersection of the frame division cross. The
percentages in the boxes express how the force on the footscan plate is spread across
the different areas defined by the areas (left/right, front/rear and four quadrants).
Numerical information about the center of pressure is shown:
position: the current, minimum and maximum position in millimeter for the x- and y-
coordinate
range: the spread between the minimum and maximum position in millimeter for the
x- and y-coordinate
travelled distance: the length of the center of pressure line in millimeter
ellipse area: the area of the calculated center of pressure ellipse in square
millimeter
The used coordinate system to perform the calculations is adjustable in the
Coordinate system combobox and is visualised in the plate miniature (x-axis in blue, y-
®