10.9 Impulse
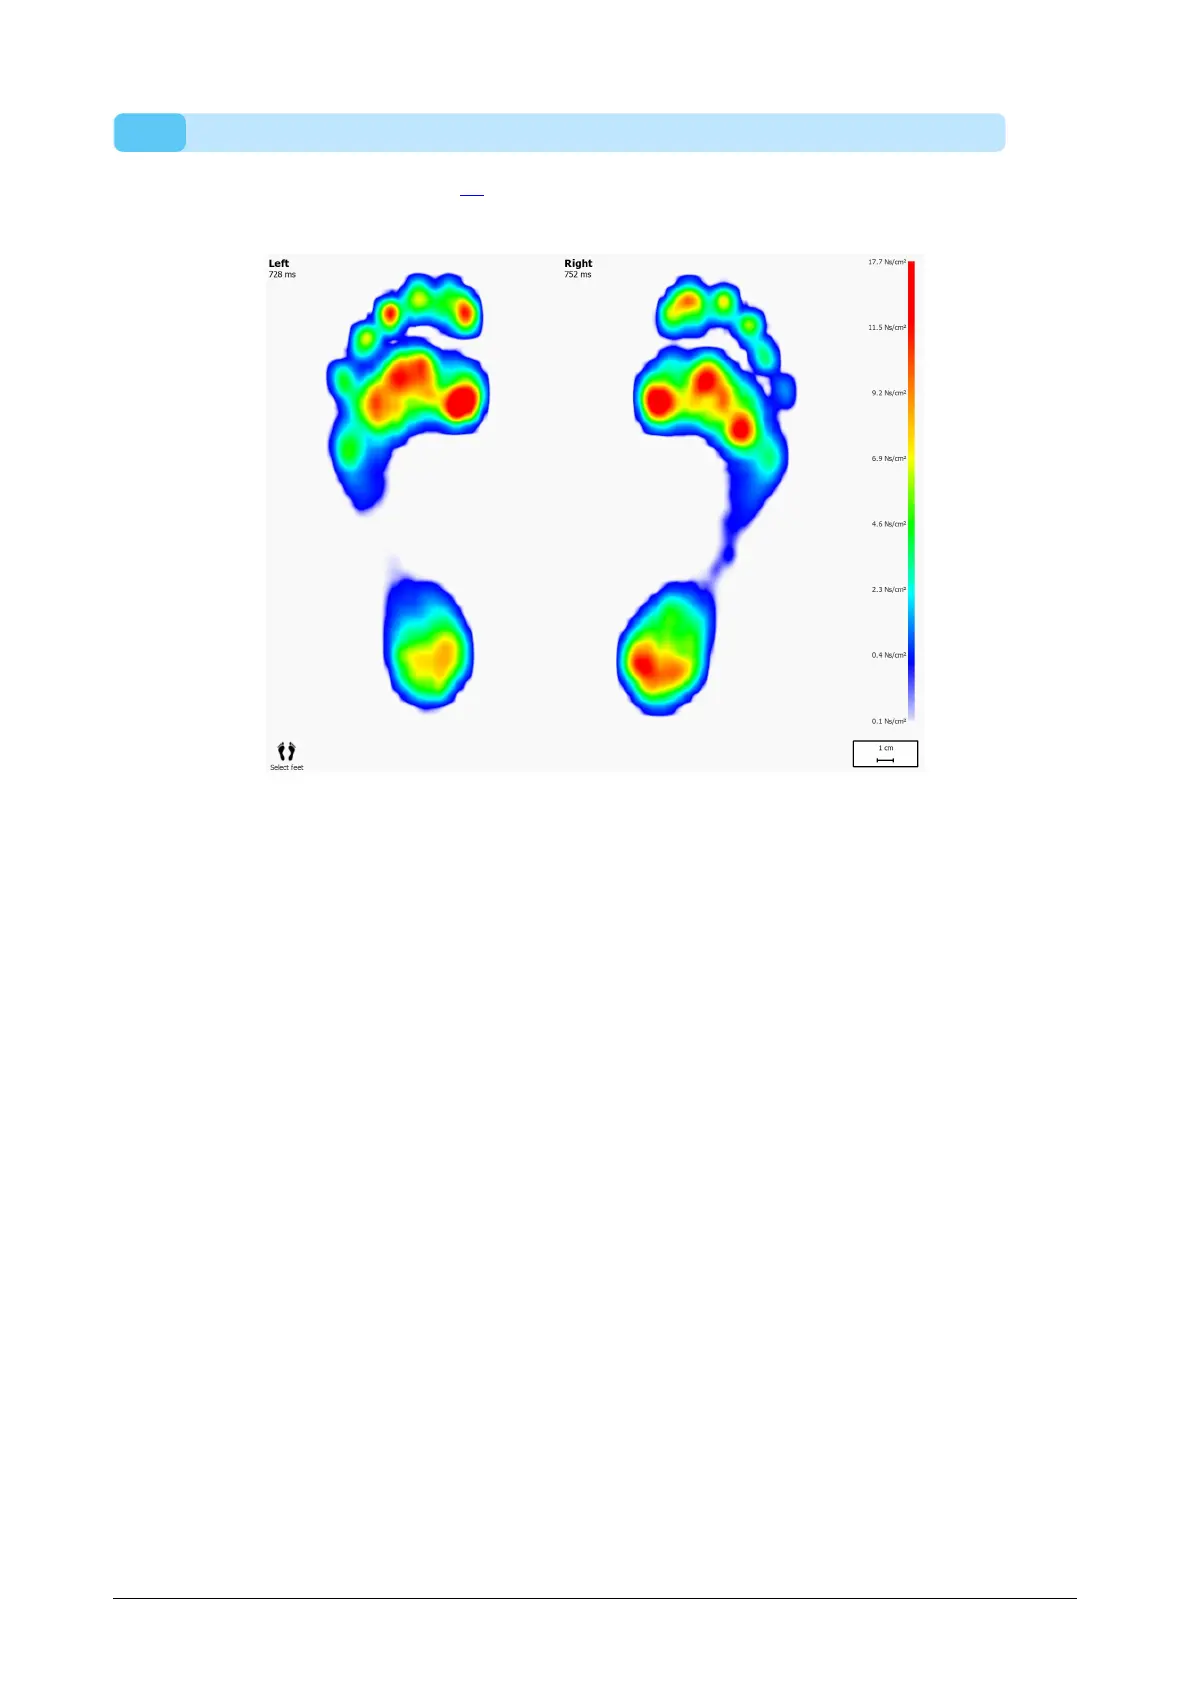
The Impulse analysis (Figure 46) displays the total impulse applied on each sensor of
the current foot selection. The color scale expresses impulse in
NS
/
CM
2
.
Figure 46: The Impulse analysis shows the total impulse applied on the current foot
selection as an image. Red indicates an impulse value higher than 65% of the
maximum impulse value.
The impulse analysis draws all sensors with impulse values higher than 65% of the
maximum value red. Areas of such high pressure may indicate an increased risk, e.g.
the risk for ulcers in diabetic patients.