10.12 Load rate
The Load rate analysis (Figure 49) evaluates the rate at which the force applied on each
anatomical zone changes. More specifically it displays the derivative of the force applied
on each zone (expressed in
N
/
S
).
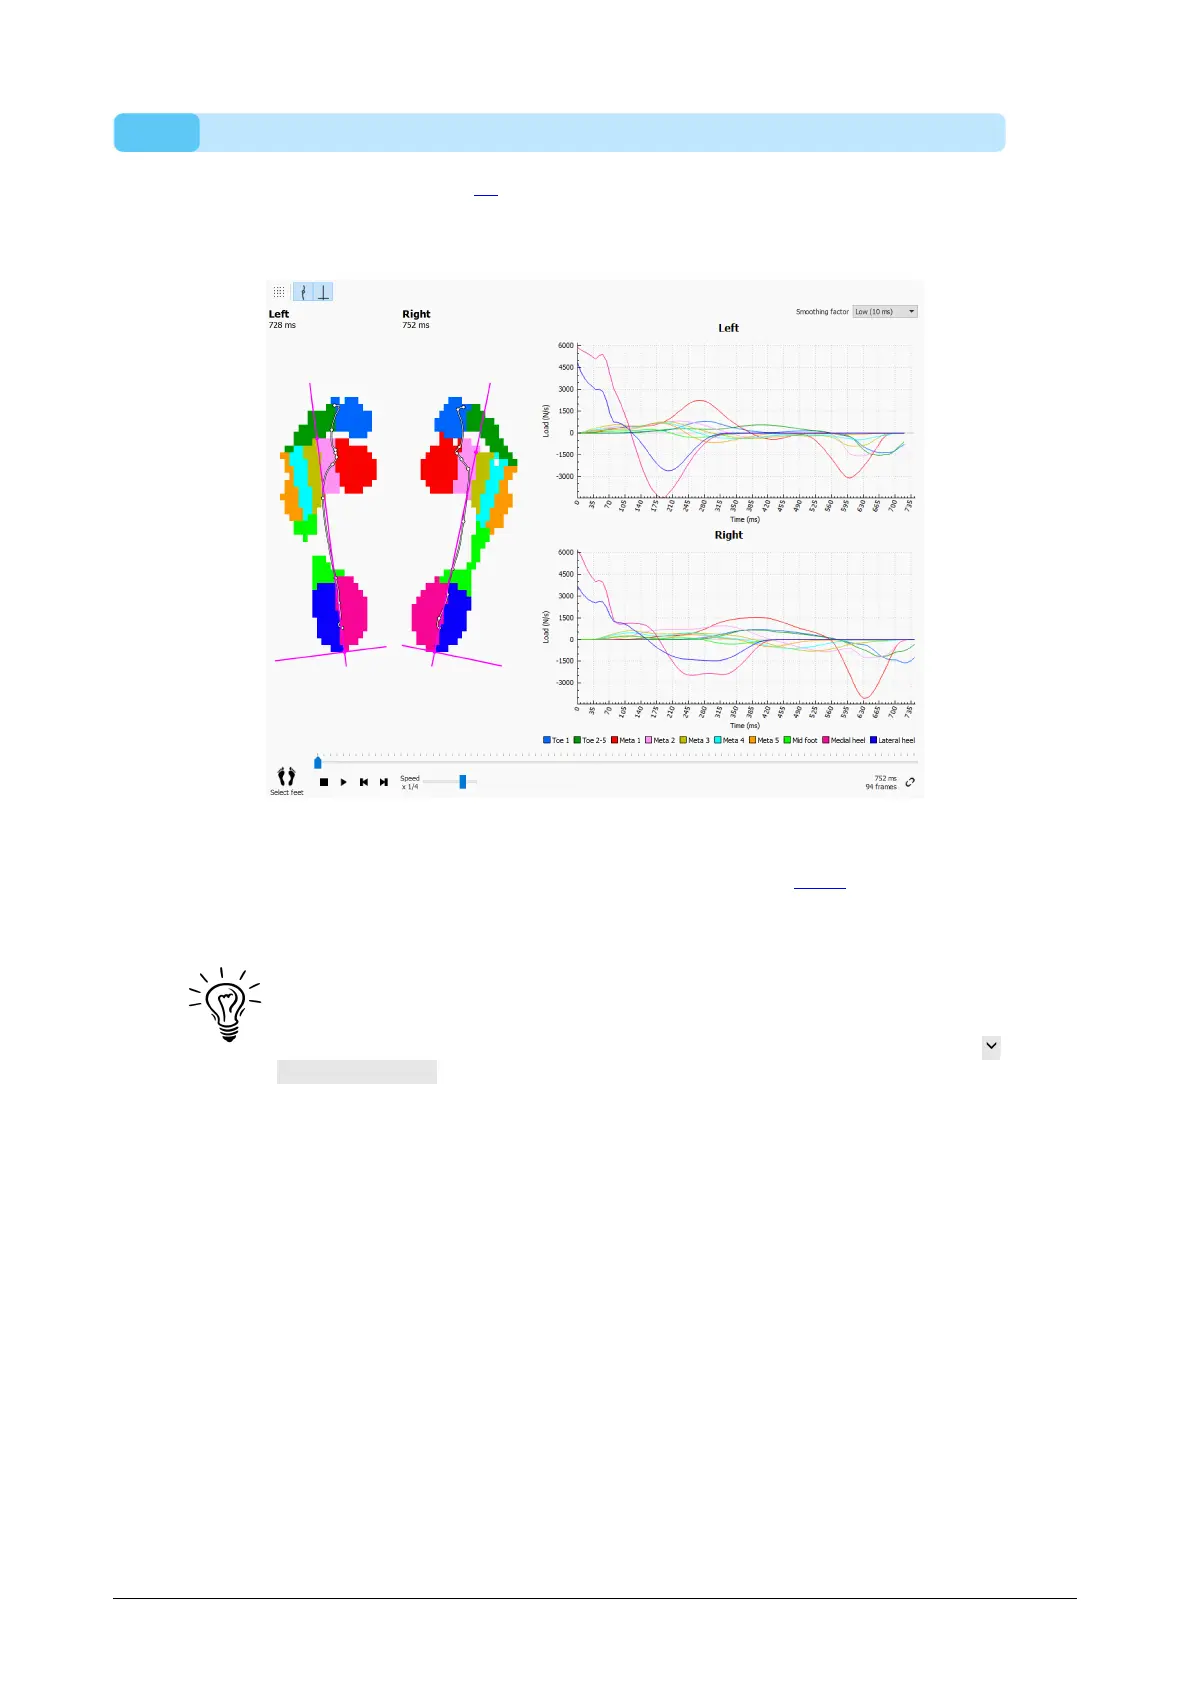
Figure 49: The Load Rate analysis displays the rate of change of the force applied on
each anatomical zone.
The Load rate analysis is identical to the Zones analysis (Section 10.10) besides the
contents of the graphs, which contain the load rate per zone of the current foot
selection.
Keep in mind that computing a derivative numerically is very sensitive to
measurement noise. The Load rate analysis filters the load rate graphs with
an averaging mask to reduce the influence of such noise. As a result the
graphs are smoother. Select the width (in ms) of the averaging mask in the
Smoothing factor drop-down selection.