ONLINE HELP SOPAS Chapter 7
LECTOR®620
Analysis
8013778/Y269/2013-11-27 © SICK AG · Germany · All rights reserved · Subject to change without notice 165
7 Analysis
Analysis
7.1 Event monitor
Input signals and output signals can be monitored via the diagrams on the Event monitor
tab.
7.1.1 Event monitor
Input signals and output signals can be monitored via the diagrams in the Event monitor
group.
Using the signal visualization, events such as triggering or switching outputs can be tested
and the logic and function of signal sequences checked.
For additional information see the F1 help.
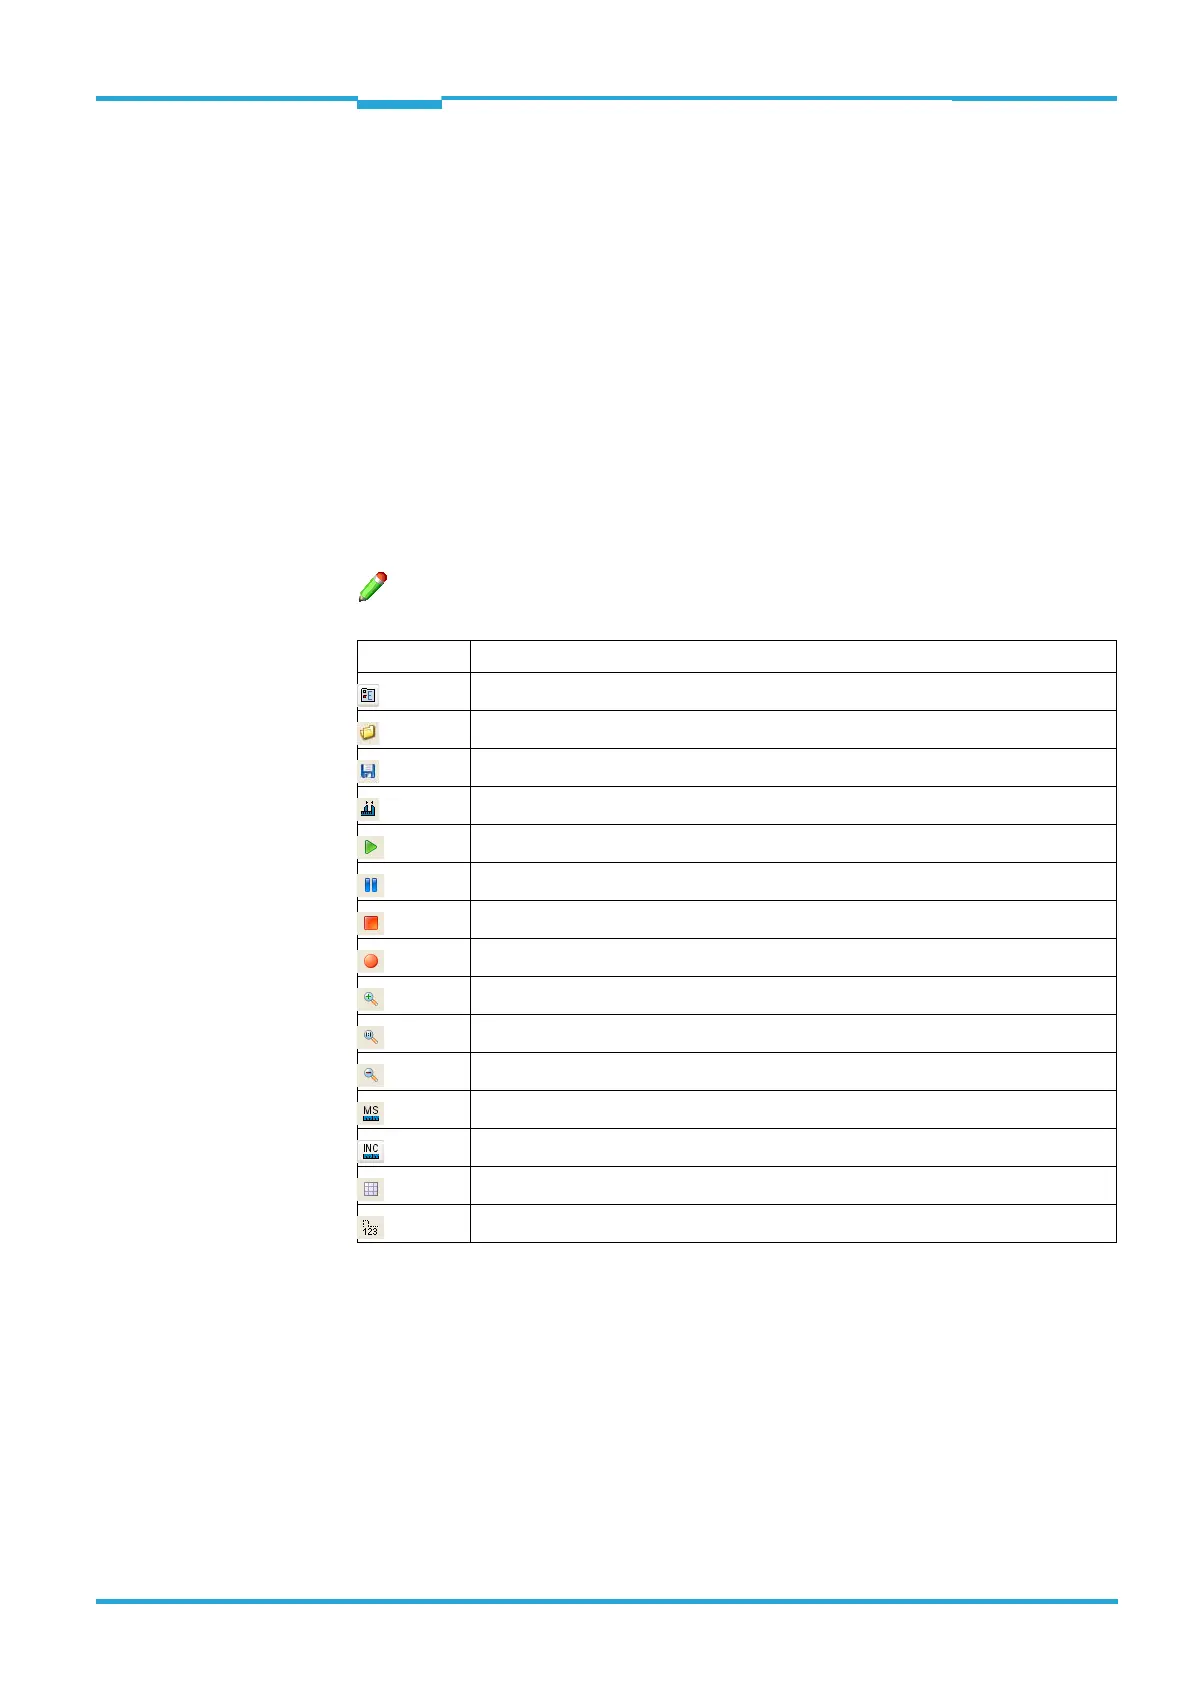
Symbol Function
Select signal that has to be monitored.
Open a previously recorded monitoring diagram.
Save the current monitoring diagram.
Measure distances within the diagram.
Start monitoring.
Interrupt monitoring.
Stop monitoring.
Record monitoring.
Enlarge diagram.
Set diagram zoom level to 100%.
Scale down diagram.
Indicate time axis in diagram.
Indicate increment axis in diagram.
Activate/deactivate raster in diagram.
Indicate values in diagram.
 Loading...