Spectroquant
®
Pharo 300 Operation
135
ba75703d07 04/2014
Combined display of two kinetic records in one graphic
Display of the difference of two kinetic records
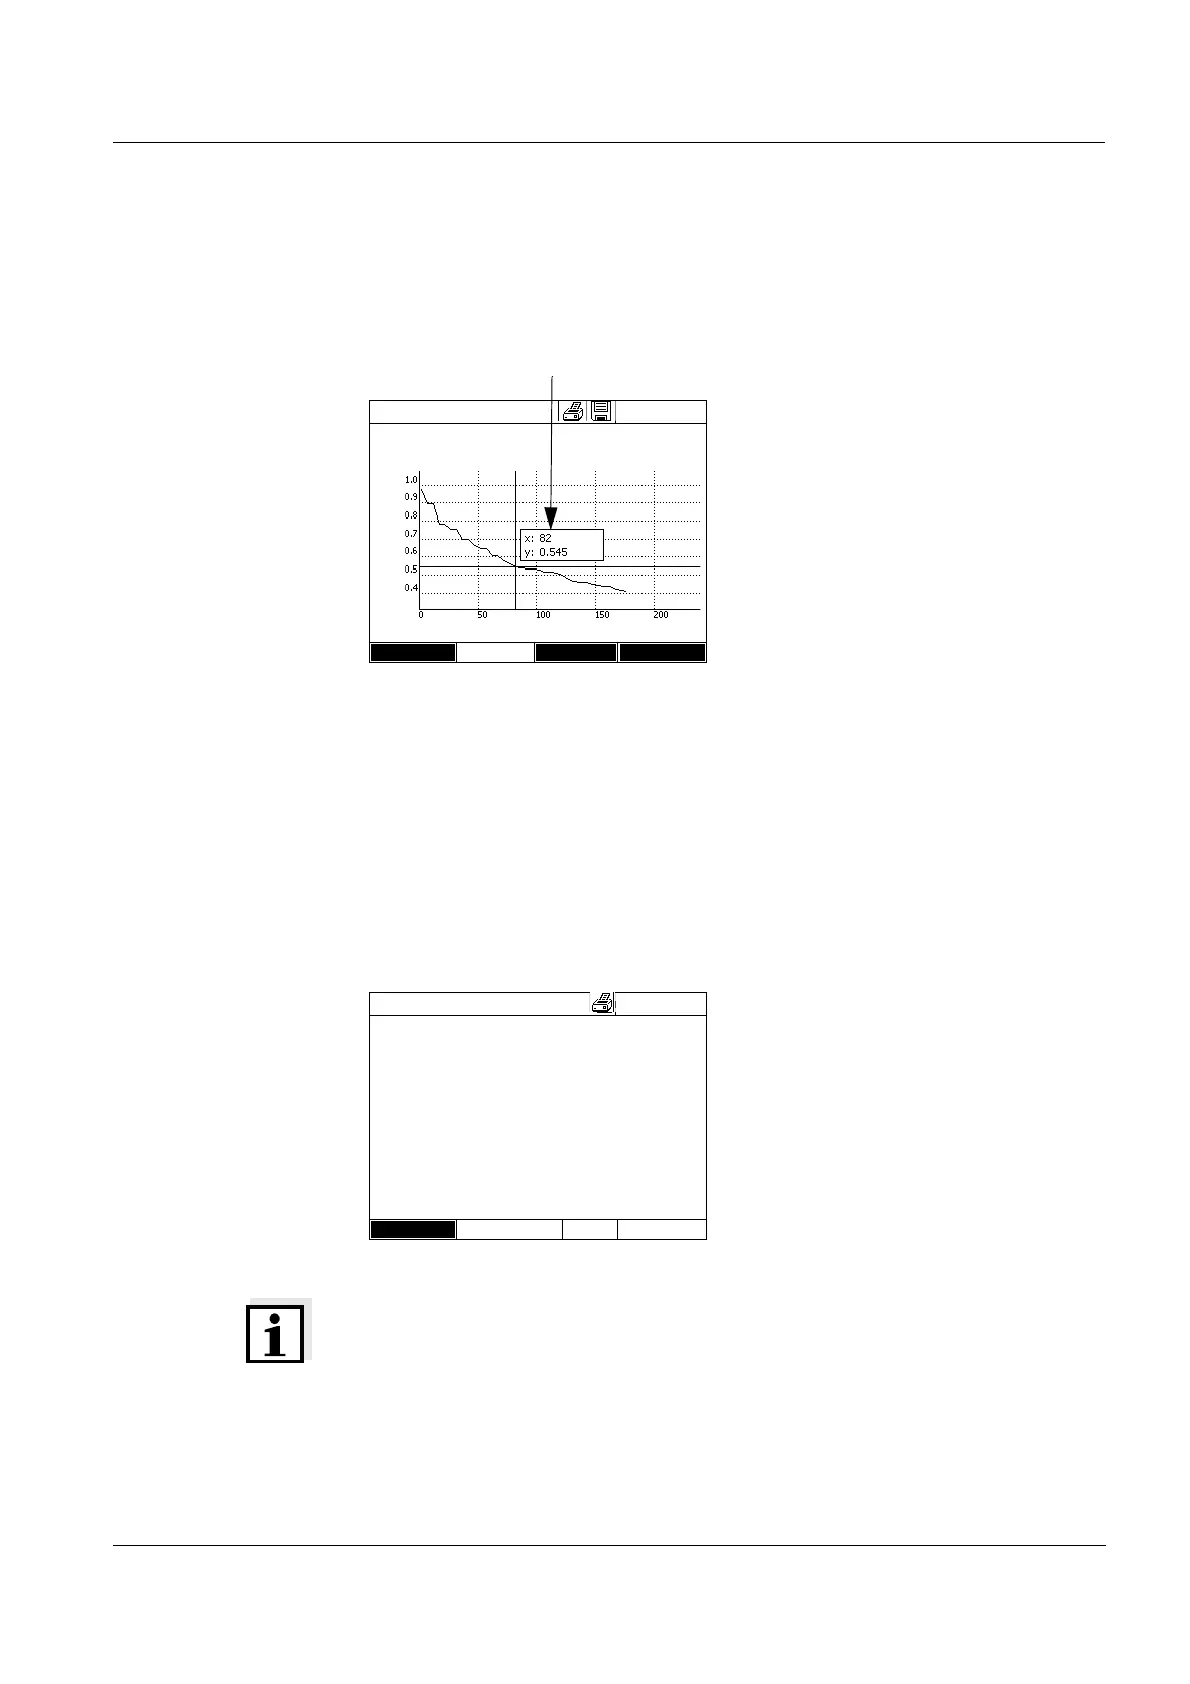
Cursor
Slope of the curve &
catalytic activity
The function, Slope & catalytic activity indicates the slope of the kinetic curve
in the individual intercepts (intervals) of the curve.
An intercept corresponds to the Interval entered in the profile.
Note
The Slope & catalytic activity function is only available if the kinetic recording
was done in the Absorbance mode.
The displayed slope for an interval is determined as follows, depending on
the slope:
The cursor consists of a horizontal
and vertical line that cross each
other on a point of the curve. A box
names the x and y values of the
point of the curve.
Move the cursor along the x axis
(time axis) with <><>. You can
scan and evaluate the curve point
after point.
Kinetics
16.04.07 9:52
4002 Number of measurements: 4
Duration: 00:00:24 Interval:00:00:06
Time [s]
Setup Edit Open
Absorbance
Cursor information
1 Indicate the slope of the kinetic
curve in the individual intercepts
(intervals) of the curve with [Edit] /
Slope & catalytic activity.
If the calculation of the catalytic
activity was selected when the
profile was created it is displayed
here together with the slope.
Kinetics
16.04.07 9:52
0.63
cat
Interval Slope [Δ/min] (Δ/Time
10.0005 s
20.00010 s
30.00015 s
40.00020 s
50.00025 s
60.00030 s
Back