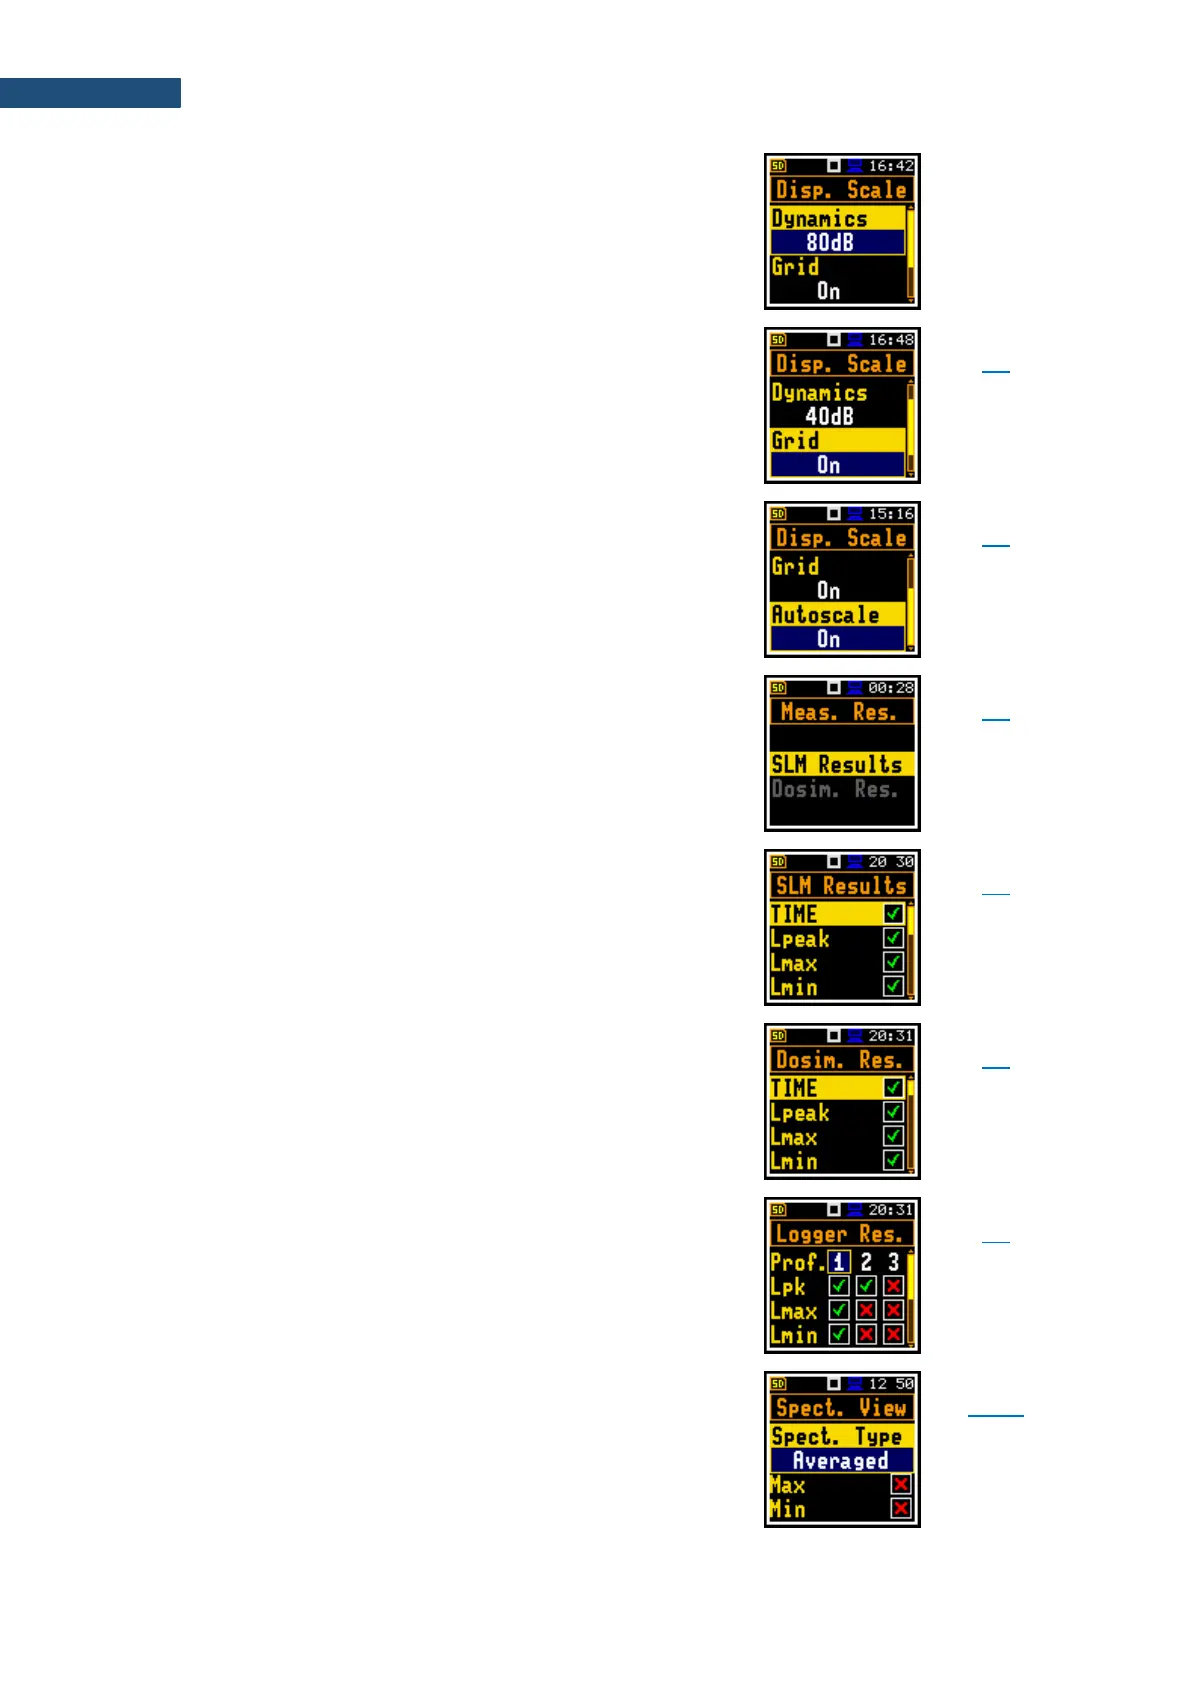
Range of the plot scale: 10 dB, 20 dB, 40 dB,
80 dB, 100 dB and 120 dB.
Toggle of the grid on the graph views.
Switching automatic scale adjustment of the Y axis.
Screen that enables selecting the
Sound Level Meter and/or Dose Meter results,
which will be presented on the display.
Screen that enables selecting the
Sound Level Meter results, which will be presented
on the display.
Screen that enables selecting the Dose Meter
results, which will be presented on the display.
Screen that enables selecting time-history results,
which will be presented on the display.
Screen that enables selecting types of spectra for
displaying: Averaged, Instantaneous, Max, Min and
Peak.
 Loading...


