12 Software description
190 CyFlow
®
Cube 8 | Operating Manual | May 2018 | Revision 032
V-Log Linearity (%) and V-Log Negative Section (%): These options
allow you to select the default values for scaling of V-Log parameters.
The accepted range is between 0 and 100%. To edit, enter a value or
use the up/down arrows.
The values entered here will be the default values displayed in the
Default Scaling tab of the Scales Properties dialogue (see chapter
Scales Properties dialogue on page 81). The V-Log group is disabled for
low-resolution data (i.e. less than 12 bits).
Reset to Default: Click the button to return the scaling options to their
default settings.
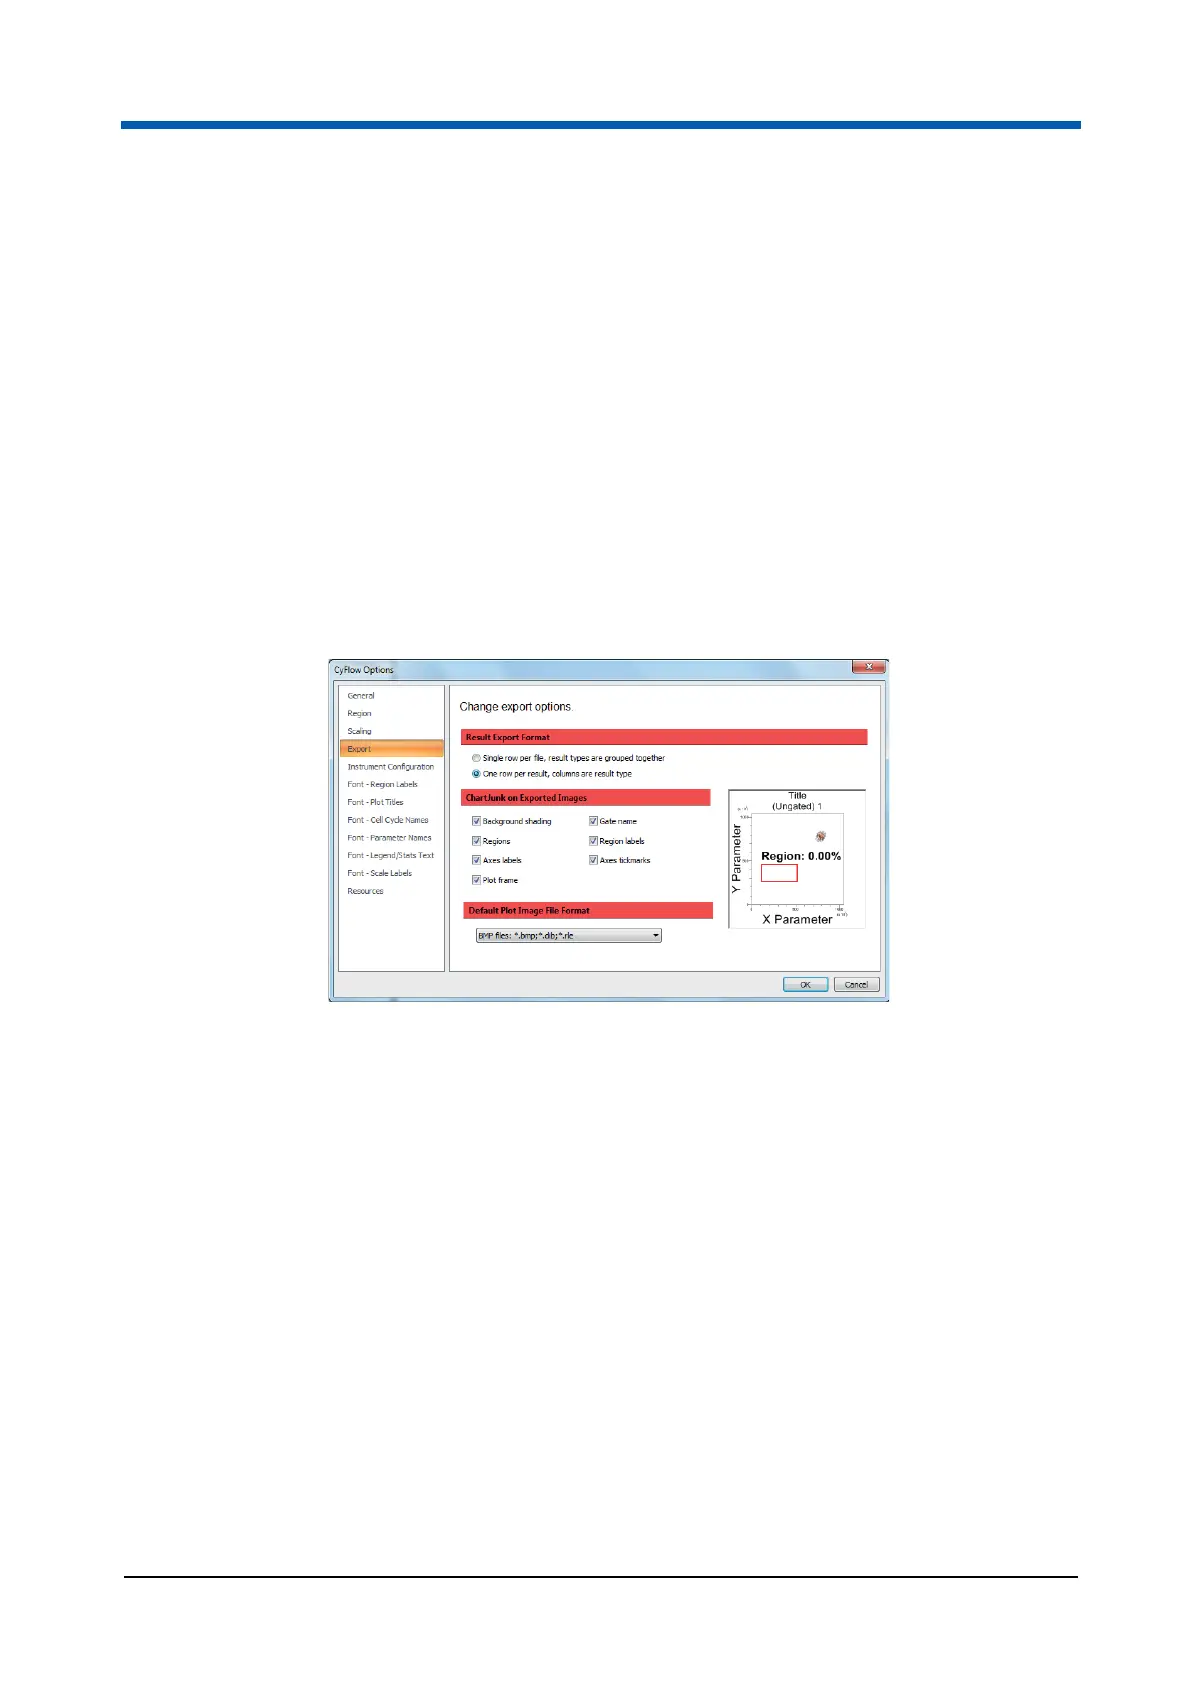
Export page
The Export page contains options to specify how results are to be exported
to CSV files and to specify default options used when images are exported.
The page contains the following options:
Result Export Format: Select the "Single row per file, result types are
grouped together" option to display all the results from the results table,
grouped together and exported in a single line. If multiple files are
exported, a new line is created for each file. When using Microsoft
®
Excel
2003 the maximum number of columns is limited to 256. If you need to
generate tables with more than 256 columns, you should upgrade to
Excel 2007.
Select the "One row per result, columns are result type" option to display
all the results from the results table, exported in the order they appear in
the table
ChartJunk on Exported Images: This option allows you to select the
detail displayed on plot images when copied and pasted to other
applications (e.g. Microsoft
®
PowerPoint). Uncheck any item that is not
required for the pasted plot images.
Default Plot Image File Format: This option sets the default file format
for the "Save Plot(s) as…" menu item. Options include BMP, JPEG, GIF,
TIFF and PNG. The default setting is BMP.