12 Software description
90 CyFlow
®
Cube 8 | Operating Manual | May 2018 | Revision 032
The Plot Compensation group contains the following options:
Plot Compensation: To enable plot compensation, select a plot in the
Plots area that contains the parameters required for compensation and
then click the button. The button is highlighted, and the arrow buttons
and manual dragging of populations on plots in the Plots area are
enabled. The Plot Compensation button will be unavailable if a plot is
selected which does not contain compensable parameters, for example
Time or Scatter parameters.
When Plot Compensation is enabled, the selected plot shows a diagonal
line from bottom left to top right to assist with drag/drop compensation.
Then either click and drag a population into the correct position or use
the arrow buttons to move the population to the required position.
Comp %: The fields display the current compensation values for the pair
of parameters present on the currently selected plot. The top (X) field
shows the subtraction of the Y-parameter from the X-parameter. The
bottom (Y) field shows the subtraction of the X-parameter from the
Y-parameter. The fields allow the entry of compensation values. Up to six
characters can be entered into the fields in the range 0.00 to 100.00.
Entered values are rounded to 2 decimal places.
Compensation Arrows: The arrow buttons allow the fine adjustments of
compensation % values. Use the top row of arrows to increase/decrease
the X compensation value by 0.1/by 0.01. Use the bottom row of arrows
to increase/decrease the Y compensation value by 0.1/by 0.01.
Compensation values are limited to the range 0.00 to 100.00. The
direction of the arrow icons indicates the way the plot populations move
rather than the way the compensation values change.
Quadrant Region: Click the button and then click onto a dual parameter
plot to insert a quadrant on a dual parameter plot. For information on
quadrant regions, see chapter Creating regions on page 165.
Quadrant Statistics: Statistics are displayed when the current listmode
file is compensable, a dual parameter plot displaying compensable
parameters is selected, and the plot contains a quadrant region. If the
statistic cannot be calculated due to insufficient events, the edit field will
show "ERROR". If multiple quadrant regions are present on the plot, the
statistics are only displayed for the quadrant region set created first.
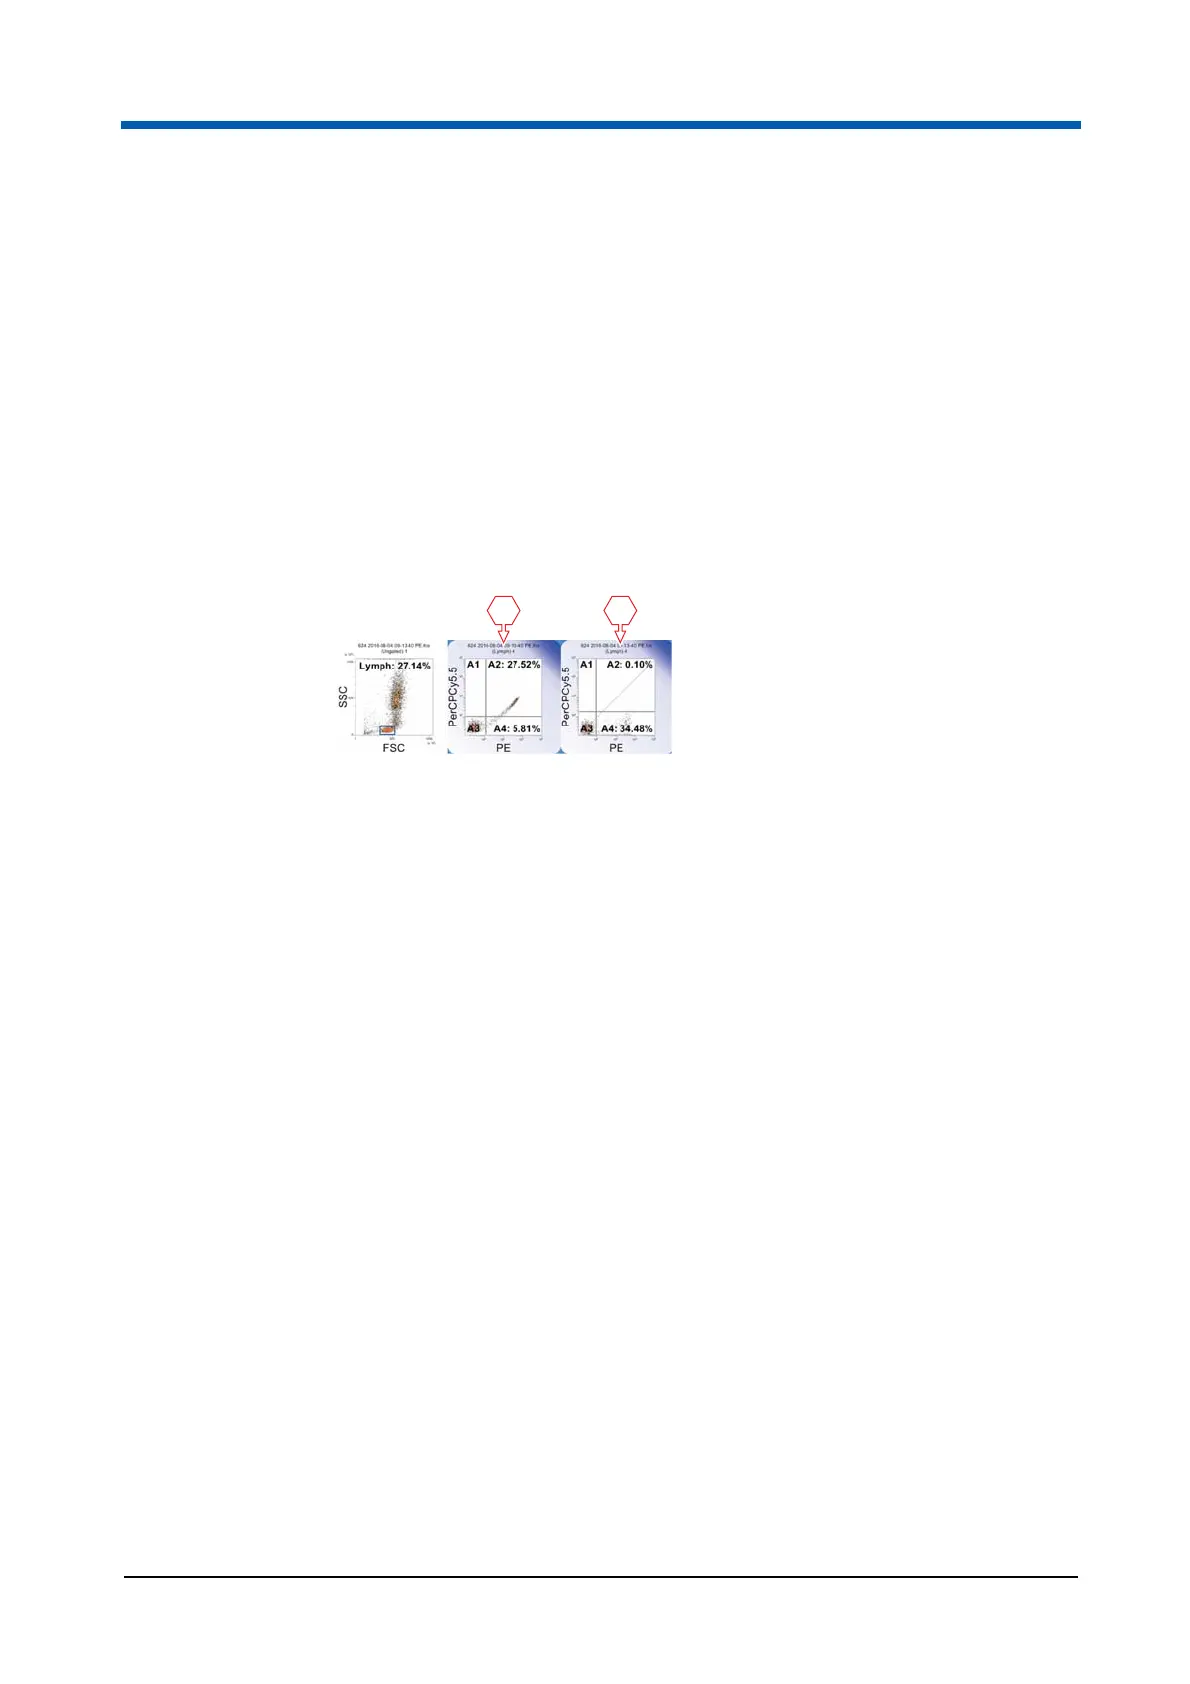
1 Original plot (gated)
2 Plot after manual compensation
1 2