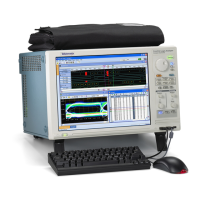
Operating Basics Viewing Results
Use the mouse to select the Horizontal cursor .Youcandragthe
cursors to change the positions, and read the voltage values on the Y-axis.
Waveform Plot
You can select the Waveform Plot option to view the Waveform Plot for the unit under test. The Waveform
Plot has a Zoom and the Cursor feature that you can use to view the results.
The Waveform Plot has features that enable you to zoom in and out on the waveform, use Vertical and
Horizontal Cursors, Save the Plot, Reset the original plot, and select to display the signals.
To display any or all the signals for the waveform plots menu, you can use the following options:
Zoom: Yo u can select the Zoom from the menu. Select the
icon to zoom into the area of interest.
Define the area of interest using the mouse and selecting the zoom in area. The entire upper half of the
oscilloscope displays the selected area. Select the
icon to zoom out. You can use the Zoom In and
Zoom Out icons until the application reaches the maximum and the minimum zoom limit.
Cursor: You can select the Cursors and the vertical cursors appear.
Drag the cursors to change the positions of the cursors, and read the time values on the X-axis.
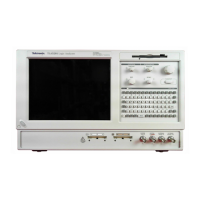
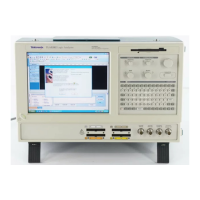
54 TDSUSB2 Universal Serial Bus Measurements Package