5.1 Fast Logging Settings and Graph
Complete the instructions below to select the settings and display the Fast Logging graph.
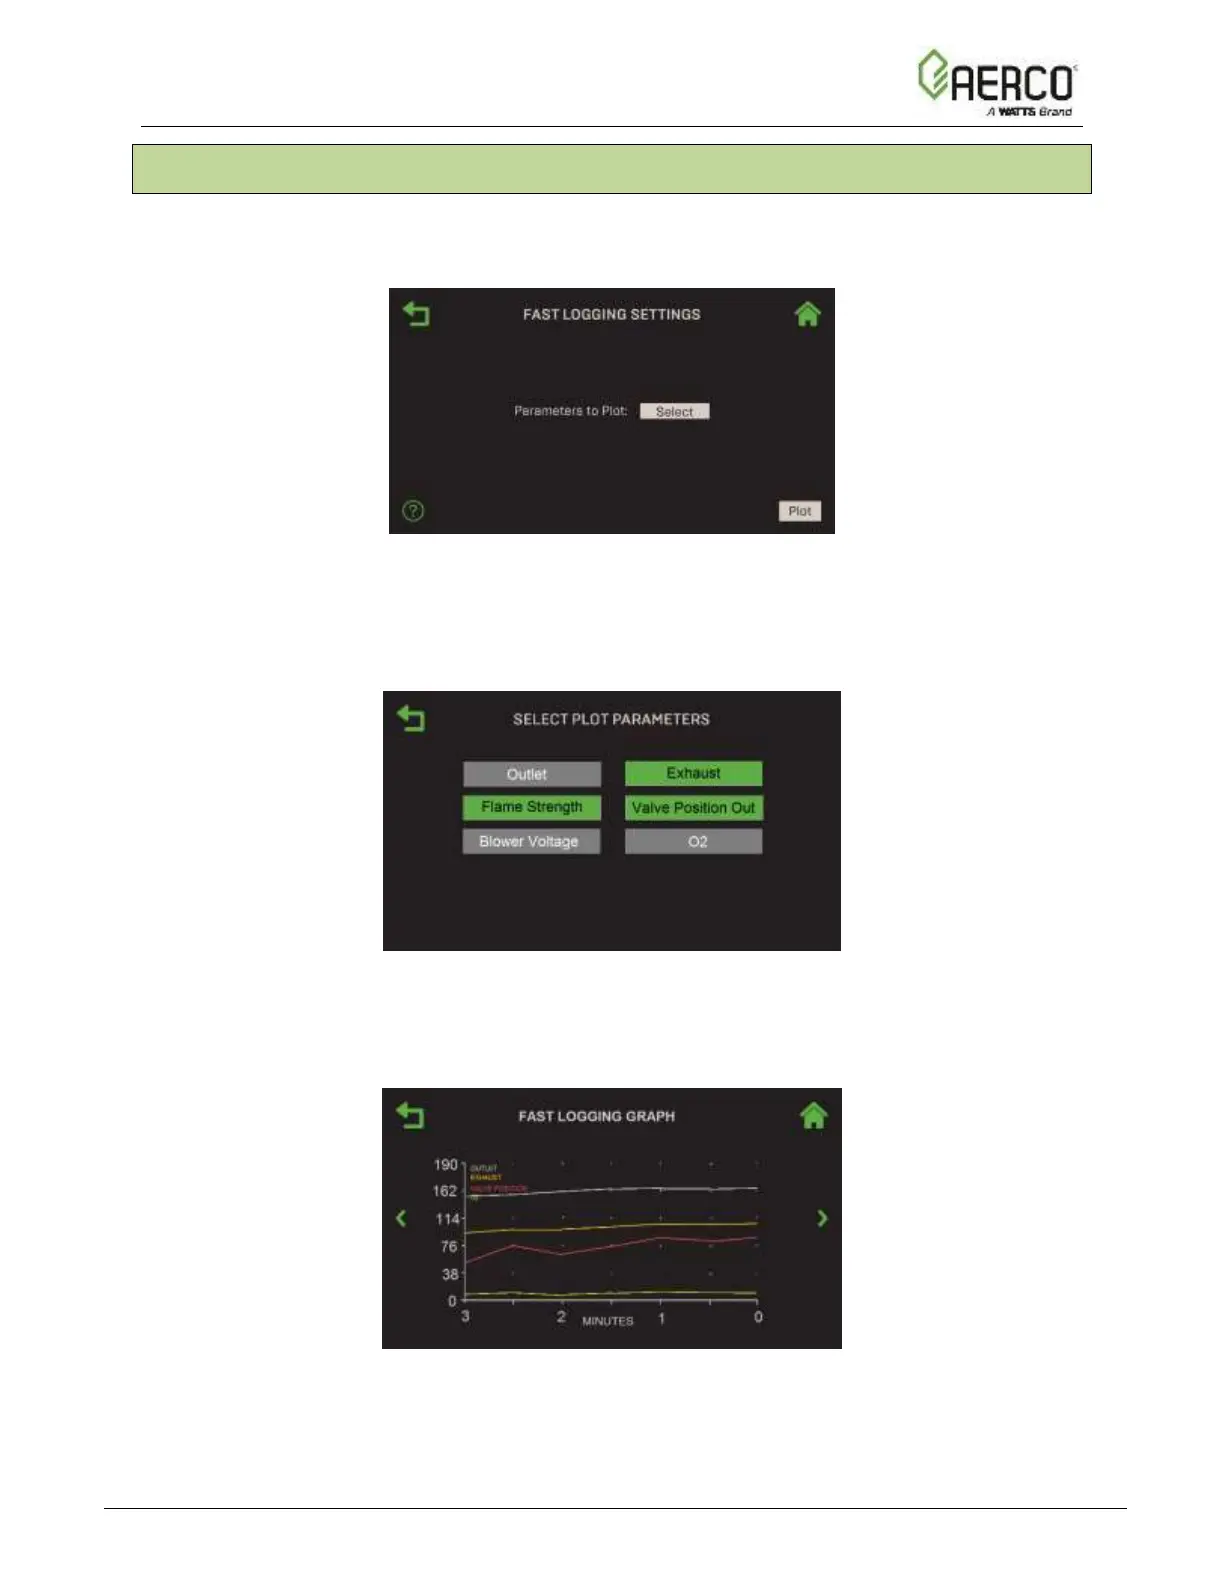
1. Go to: Main Menu → Trending → Fast Logging Settings.
Figure 5.1-1: Trending: Fast Logging Settings Screen
2. Press Parameters to Plot. The Select Plot Parameters screen opens, displaying the
parameters available in this graph. You can select up to 4 parameters. The selected item(s)
turn green. Any new selection will create a new plot; the previous selection will be deleted.
Figure 5.1-2: Trending: Select Plot Parameters Screen – Fast Logging
3. Press the Back button to return to the Fast Logging Settings screen.
4. Press the Plot button to create the new graph.
Figure 5.1-3: Trending: Graph Screen
5. Once the graph has been created, you can return to it any time by going to: Main Menu →
Trending → Fast Logging Graph.
![Watts AERCO Edge [ii]](https://data.easymanua.ls/products/808371/200x200/watts-aerco-edge-ii.webp)
 Loading...