5.3 Monitoring Machine Operation
5.3.3 Realtime Tracing
5-45
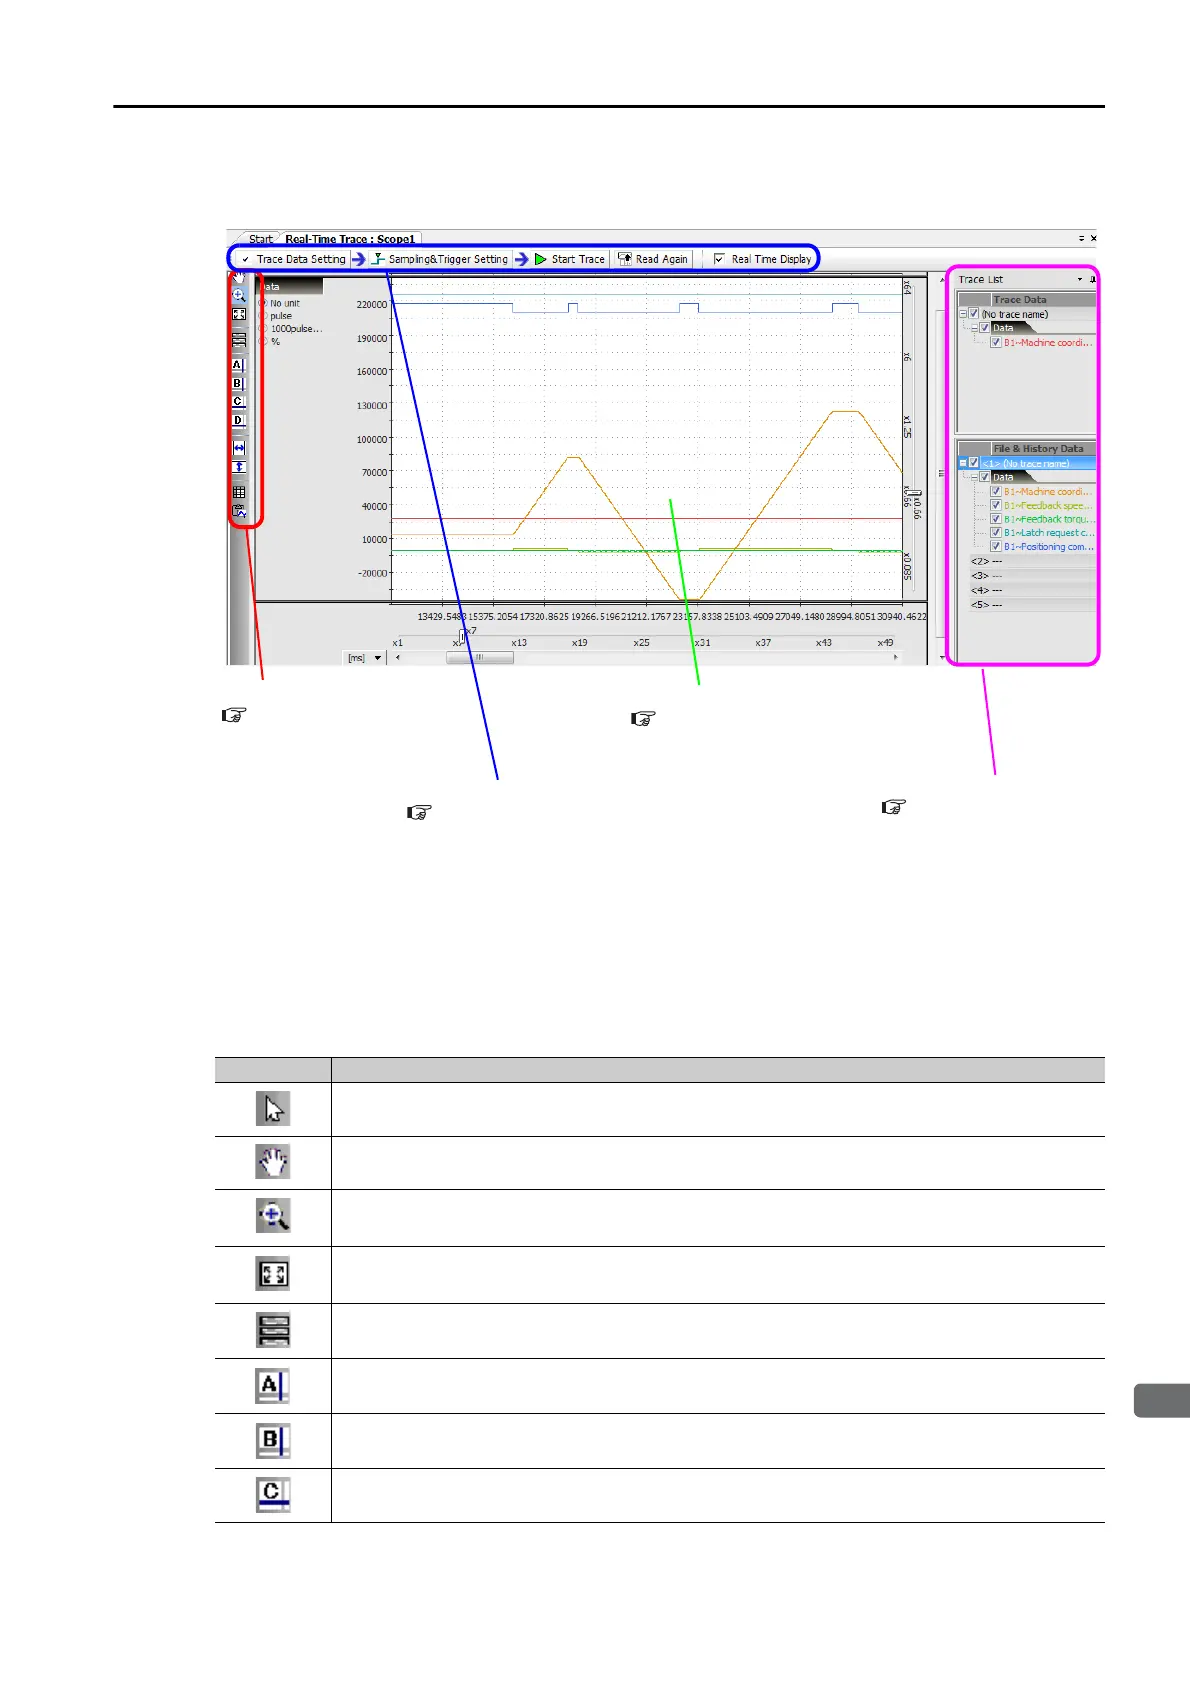
Names and Functions of the Real-time Trace Tab Page
Items
Graph Toolbar
The following table gives details on the icons.
Icon Function
Click the Select Icon, and then double-click the target area to enlarge the display.
Click the Scroll Icon to move the target area. Double-click the target area to enlarge the dis-
play.
Click the Zoom In Icon, and then drag or double-click the target area to enlarge the display.
Click the Reset Icon to return to the original display of the graph.
Click the Split Graph Display Icon to display the graphs separately.
Click the Cursor A Icon to display cursor A, and then move it on the graph to display the val-
ues.
Click the Cursor B Icon to display cursor B, and then move it on the graph to display the val-
ues.
Click the Cursor C Icon to display cursor C, and then move it on the graph to display the val-
ues.
Continued on next page.
Graph Toolbar
page 5-45
The Graph Toolbar contains
buttons to analyze the trace
data.
Trace Execution Toolbar
page 5-46
This toolbar contains the
Trace Data Setting, the
Sampling & Trigger Set-
ting, and the Start Trace
Buttons to perform these
operations in this order.
Trace List
page 5-55
The Trace List Area dis-
plays the trace data, and
the file and history data.
Trend Graph
page 5-52
This graph displays the trace
data. You can use the Graph
Toolbar, the sliders, and the
cursors to analyze the trace
data in realtime.
 Loading...