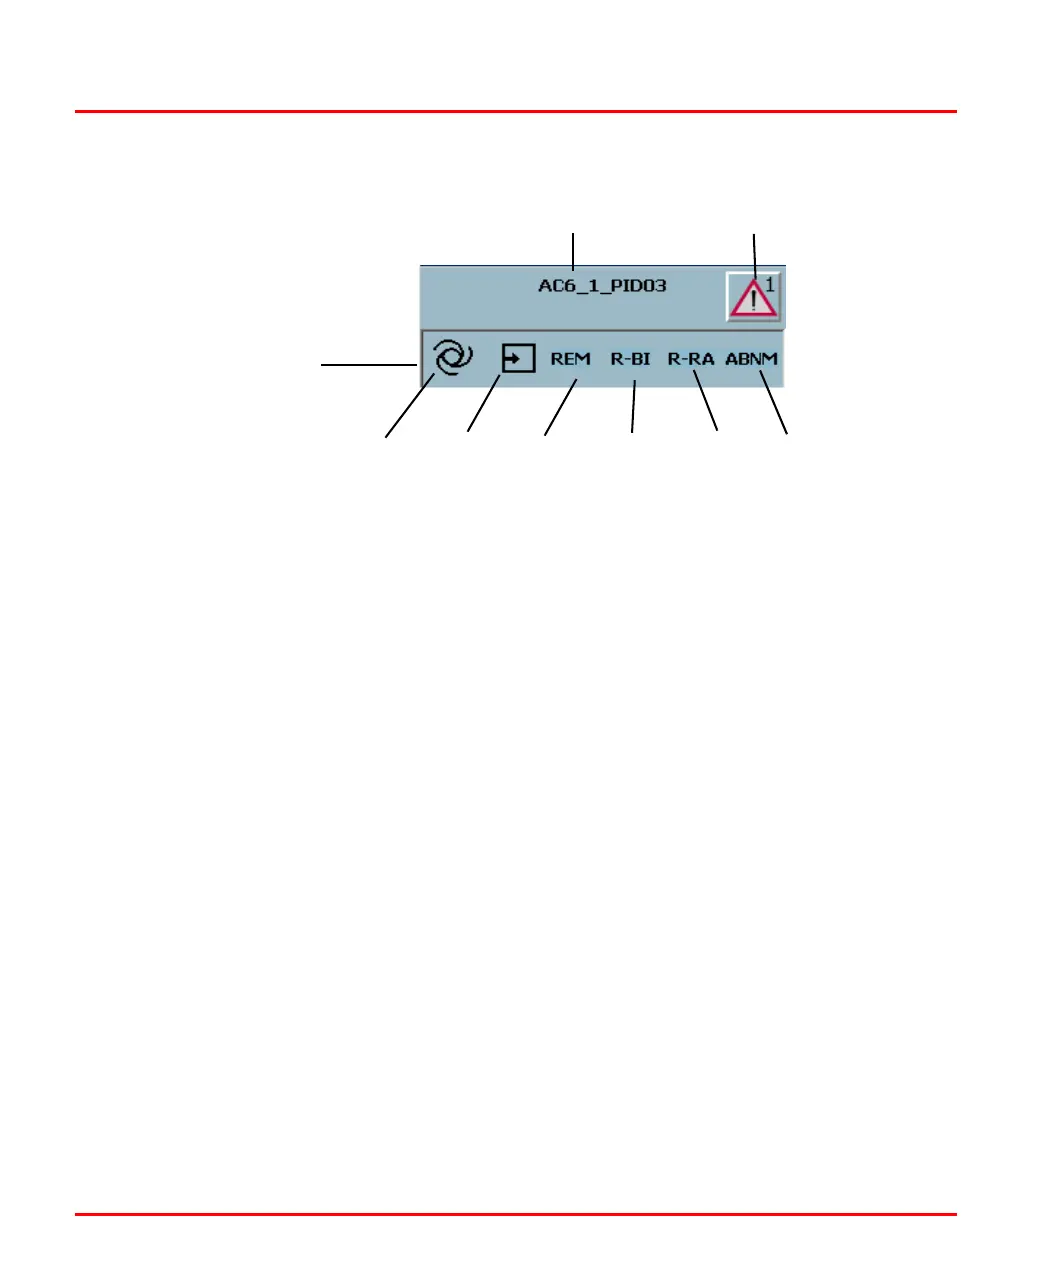
Figure 10. Faceplate Name Area Features
Tag Alarm Acknowledge
Abnormal
Auto/
Status Area
Loc/Rem
Tra ckManual
State
Loc/Rem
Bias
Loc/Rem
Ratio
Computer
/ Local
or Ramp
Setpoint
or
Output Track
Mode
Process Bar Graphs and Values Section 3 CCF Displays
40 3BUR002418-600 A
Process Bar Graphs and Values
The area shown in Figure 11 contains graphical and numerical representations of the
tag being monitored. The bar graph area includes scaled indication bars for
measured value (Pv), setpoint (Sp) and output (Out); slider controls to change
setpoint and output; and alarm markers. The number area includes measured value
(Pv), setpoint (Sp), control output (Out), setpoint high and low limits and ratio (Ra)
and bias (Bi) values. You can use the number area to enter a value for operator
controllable values (configured limits are enforced). Alarms are indicated using
colored backgrounds for priority, flashing for unacknowledged, and the characters H
(high), L (low), D (Deviation), R (Rate) and ? (Bad Data Quality) in front of the
display value. Infinite values will show ?Inf (variations shown on other displays
such as ?1.#IO for status blocks or 1.$e+000 for Loop FCM). The background color
corresponds to the priority color of the highest priority alarm currently active.