User Manual AMETEK Programmable Power
RS Series 114
8. Move the cursor to the START field and press the ENTER key. The display that you selected
will be shown. If you are in CONT trigger mode, the data will be updated about once per
second.
You can return to the HARMONICS/TRACE ANALYSIS screen by pressing the ENTER key. To
display the data in a different format, change to the selections you want and move the cursor to
the VIEW field. Pressing the ENTER key will re-display the data without triggering a new
acquisition. (This is true even if you were in CONT trigger mode.) To start a new acquisition, you
must go through the START field instead.
4.6.1.2 Analyzing FFT data
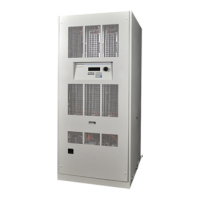
The data displays available for FFT data allow you to scroll through the entire data set. For table
displays, the UP and DOWN arrow keys may be used to scroll through the table data vertically.
The knob has no function while in this display mode. The triangle on the left edge of the LCD
screen points to the current position in the table.
Figure 4-33: Scrolling Through Tabular FFT Data
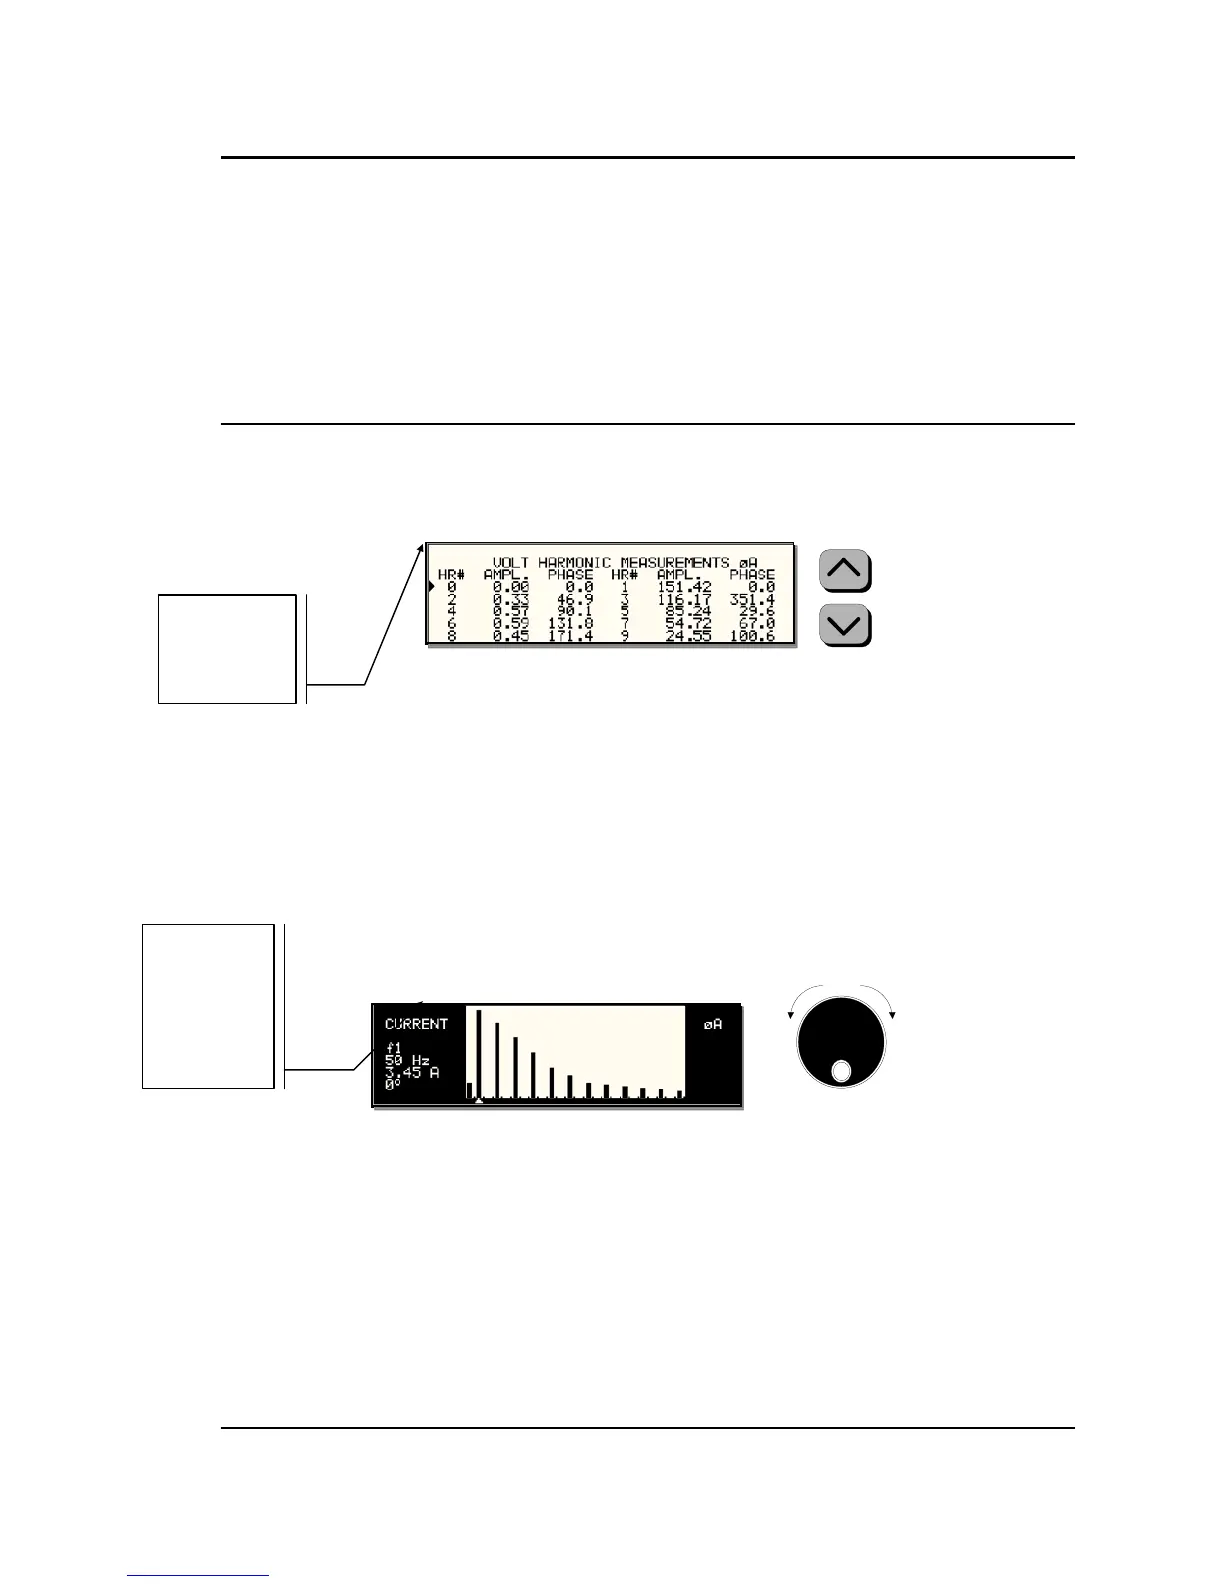
Bar chart format FFT data displays show the same data in a graphical format. While the
amplitude information is shown graphically, phase data is only displayed in numeric form to the
left for the currently selected harmonic component. The display can show up to 24 components
at a time. The triangle at the bottom of the display shows the currently selected component for
which numeric data is shown on the left. This data includes the harmonic number (DC through
50), the absolute or relative amplitude (depending on selected VIEW mode) and the phase angle
with respect to the fundamental. The knob can be used to scroll through the display horizontally.
The UP and DOWN cursor keys have no effect in this display mode.
Counter
Clock
wise
Clock
wise
INCRDECR
Figure 4-34: Scrolling through bar chart FFT Data
Arrow indicator
can be moved up
or down using
 Loading...