94 - Documenting Calibrator
As the calibration advances, the graph is drawn from point to point. A
grey column indicates where next target point is. The width of the grey
column is based on Max. Point Deviation setting. Numeric values for the
next target point can be seen in the lower right corner. If any of the points
exceed the error limits (blue dotted lines), the graph is colored red.
The Pause button ( ) allows you to reject a calibration or undo a
point. The Note button ( ) allows you to add notes to each calibration
point. For further options, open the menu.
If you need to change the Pressure Module during the calibration, see
chapter Changing the Pressure Module During Calibration.
Note: Certain tools available in Calibrator are also available in
Documenting Calibrator. To see the tools, open Calibration
window menu, select either Input or Output and from the
opened window, tap on the Tools button ( ). The available tools
depend on the Quantity and Port selected for the input/output.
The same tools are also available when editing the instrument
data.
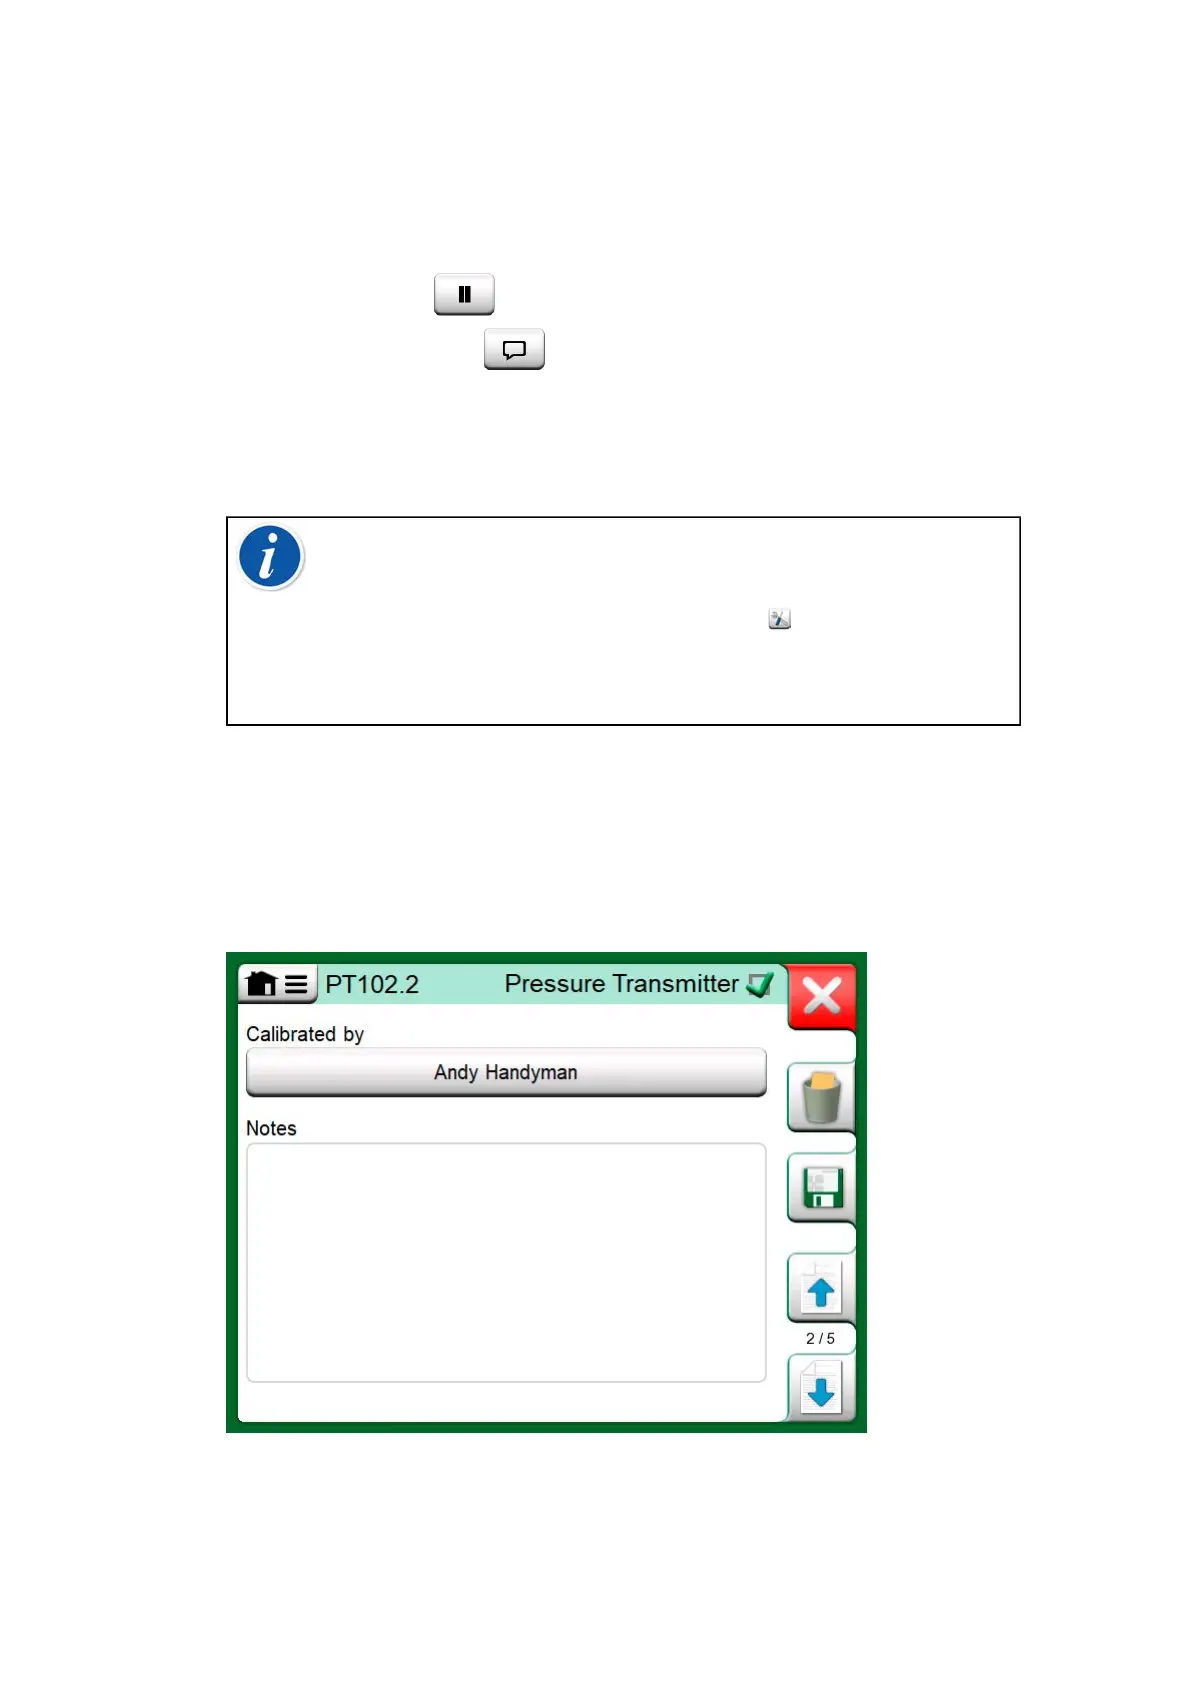
When the calibration is completed, the first of Calibration Result window's
pages open telling you whether the calibration Passed or Failed. Browse
through the pages to get an overview of the calibration results. Note that
the amount of pages shown depends on the setting found in the window's
menu. To see the basic pages only, open menu and select Show, Basic
Pages. To see all pages open menu and select Show, All Pages.
Figure 86: Calibration results page for entering calibrating
technician's name, and possible notes