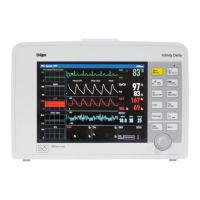
The various screen displays
1 The three different screen displays are invoked by
pressing
W
.
2 Press Q to return to the standard screen from any
screen display.
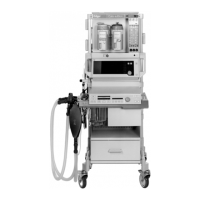
The standard screen
with the CO2 curve and another selectable curve. The
most important measured values are grouped together
on the right.
The data screen
contains all measured values with their units of measure;
simplifies the completion of the anaesthesia record.
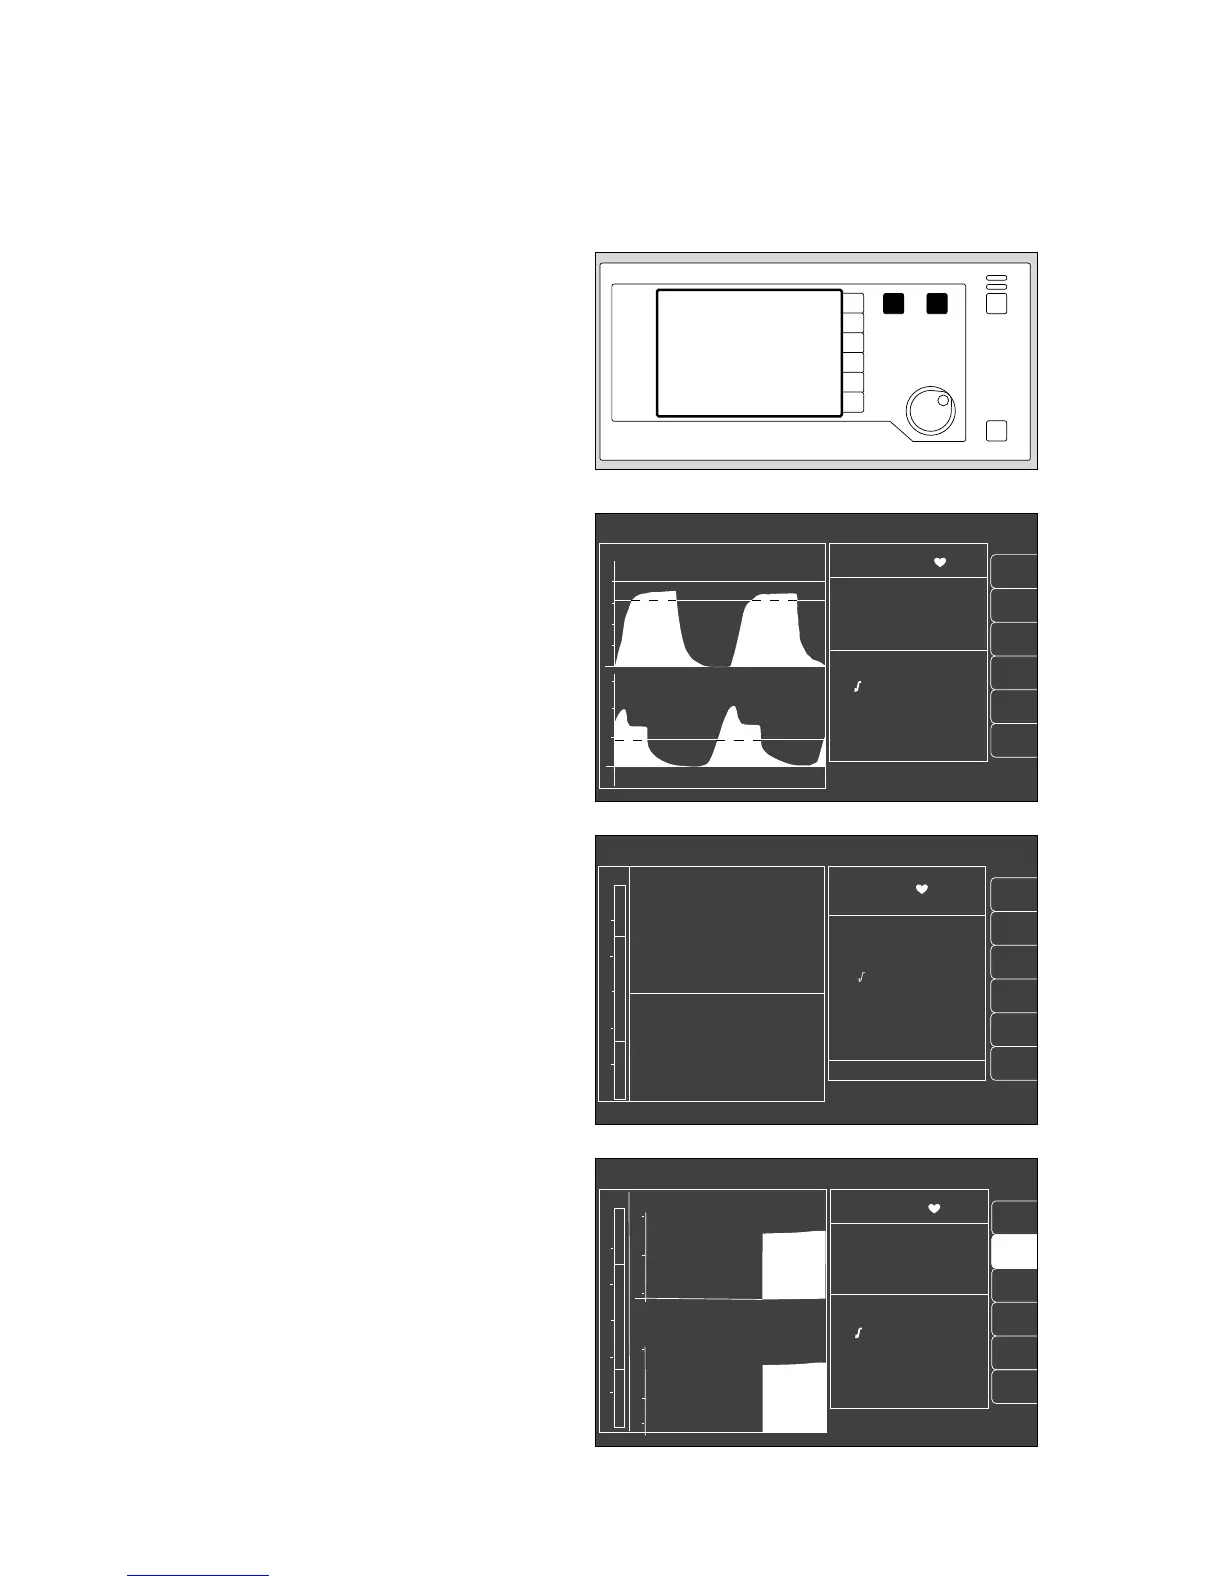
The trend screen
for displaying the changes in measured values since
measurement started.
The current measured values are shown on the right.
Operating concept
Operating concept of the monitor
The various screen displays
16
alarm
limits
auto set
vent. al.
list
IPPV alarm limits
alarm
info
10 - 03 - 97 8:00
PAW
peak 37 mbar
plat. 30
PEEP 5
mean 20
compliance 15 ml/mbar
MV 6.0 L/min
V
T
0.60 L
freq 10 1/min
AW-temp 38
o
C
20
40
0
Fi Fet
SpO
2
98 67
% 1/min
0 36
29 25
0.8 0.6
70 68
CO
2
mmHg
O
2
%
Hal.
%
N
2
O
%
sys-compl. 1.5 from 10-03
leakage 5 8 : 00
18
config.
alarm
limits
auto set
vent. al.
curve
list
config.
alarm
info
IPPV alarm limits
SpO
2
98 67
etCO
2
38
MV 6.0 freq 10
Fi Fet
O
2
29 25
Hal. 0.8 0.6
N
2
O 70 68
CO
2
40
0
PAW
20
0
20
18
SpO
2
pulse
AGas
N
2
O
IPPV alarm limits
CO
2
MV
O
2
compl.
SpO
2
98 67
etCO
2
38
MV 6.0 freq 10
Fi Fet
O
2
29 25
Hal. 0.8 0.6
N
2
O 70 68
18
MV
15
5
0
CO
2
60
30
0
11:00 12:00 13:00
PAW
20
40
0
10
full
trend
alarm
limits
12
009289710102897101128971 02328970