64 WaveRIDER
4.4.9.4 Statistics
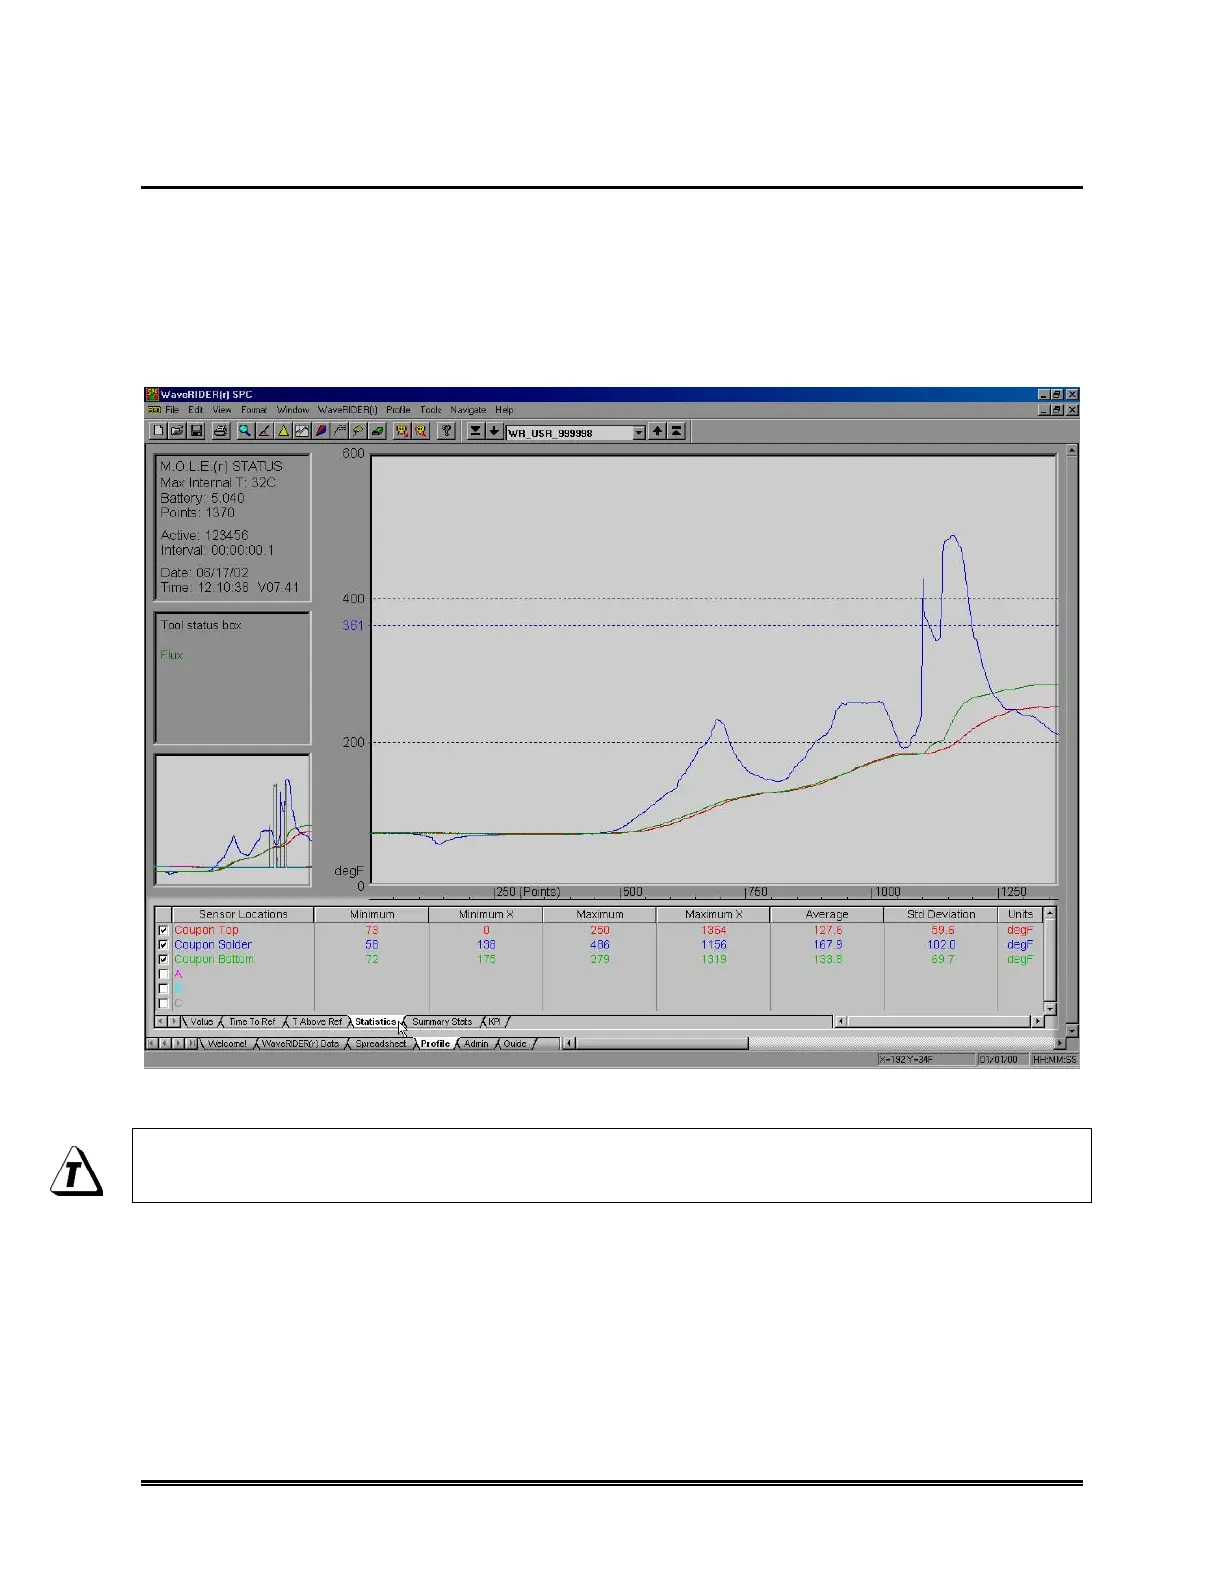
When the Statistics Tab is selected, the first four columns of the Data Table displays the
minimum and maximum temperature found for each Data Plot and the value of X (time,
distance, or point number) at which it occurred.
The last two columns of the Data Table displays the Average (Mean) and Standard
Deviation of the temperature values recorded for each sensor.
Figure 4- 33: Statistics Data Tab
If a portion of the Data Graph is magnified using the Magnify tool, the Data Table
displays the Mean and Standard Deviation of the values currently displayed.
 Loading...