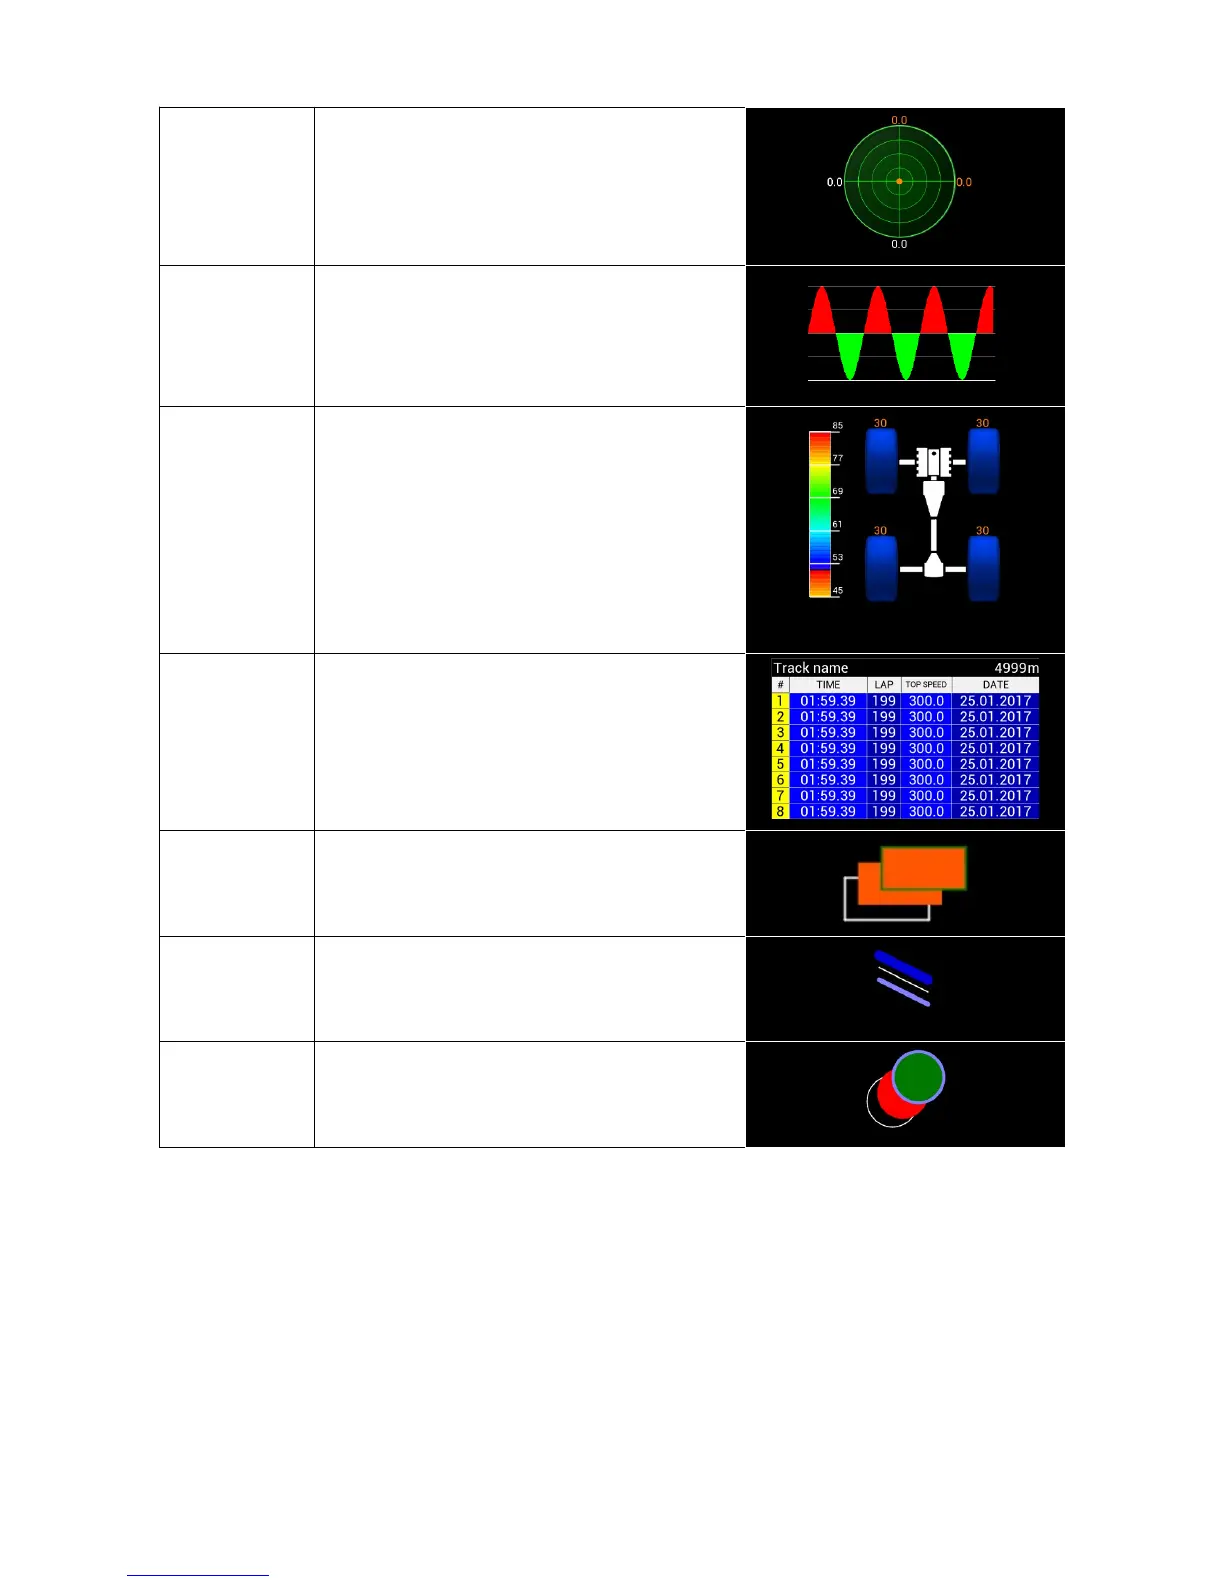
G-Force The g-force indicator uses the internal
accelerometer of the device.
Predictive
time graph
A graph displaying the current difference
between a lap time and the best time. Green
indicates a faster time, while red indicates
slower.
Tire
temperature
graph and
tire
temperature
scale
Displays tire temperature from thermal
imaging cameras and indicates their
maximum temperature. This indicator can
also display tire temperature in the form of
horizontal bars with a temperature gradient
(16 values for each tire).
Track record
table
Indicates 8 best times recorded on a given
track. These times are saved in the device
memory.
Rect Displays a rectangle in the form of a frame or
a filled-in shape.
Line Displays a line of any colour or thickness as
selected.
Circle Creates a circle of any colour, with or without
a fill color.
Page 39/137