176
1.
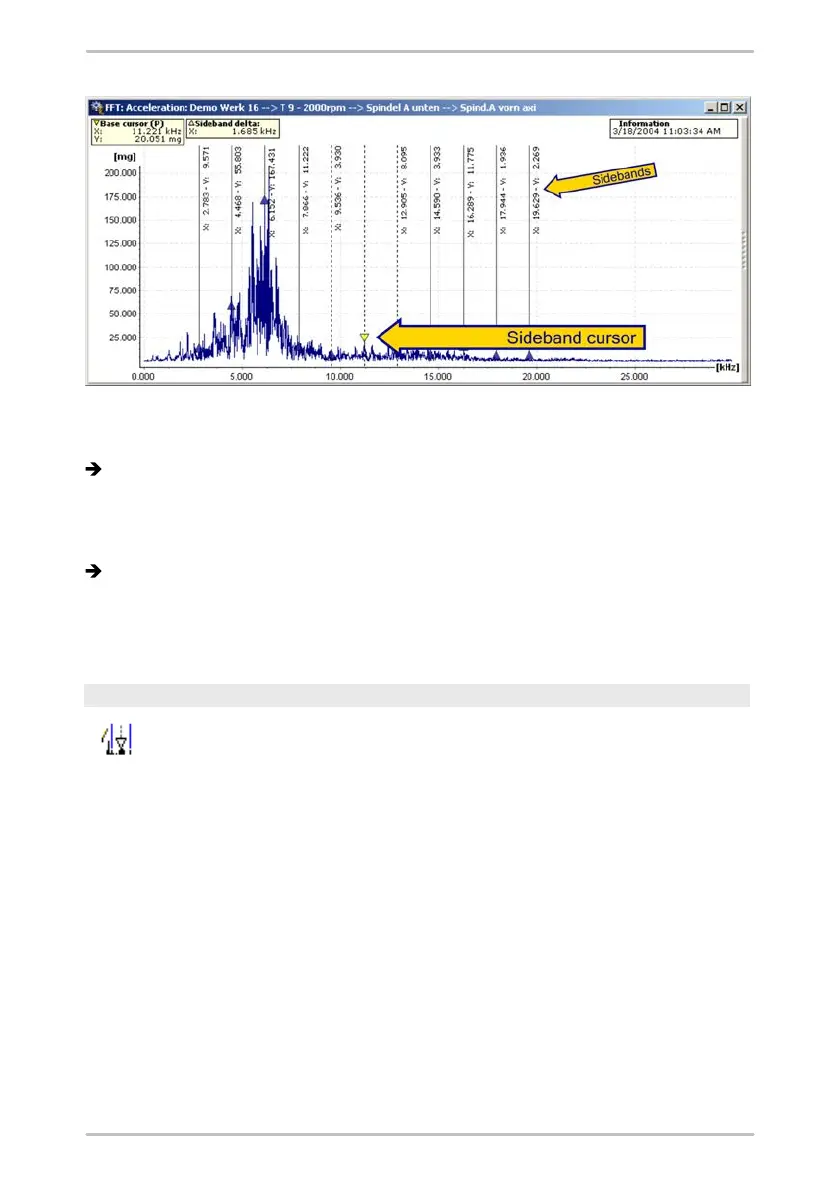
Select the sideband cursor option from the cursor selection list or press the F6
button.
The base cursor and vertical lines are displayed at the sidebands of the
frequency.
2.
You can use the left-hand mouse button to shift the base cursor to any desired
measuring point in the diagram and also modify the position of the sidebands.
The cursor information above the diagram displays the measured values for
the base cursor as well as the differential delta of the sideband frequencies.
The measured values of the sidebands are each displayed vertically as text
next to the corresponding vertical line.
HS cursor
The HS cursor (Harmonic with Sidebands) combines both cursor types
described above. This means that the measured values of the
harmonics and their sidebands will be displayed.