90 G-TECH / Pro Competition User Guide, Release 3.1
3
You will see a graph such the one shown below.
On the vertical axis, the tic marks identify 10 MPH
increments.
Each plus sign (+) identifies a 10 MPH milestone
during vehicle braking.
The cursor is “live” and can be moved along the
plot with and .
30MPH
Speed(MPH)
Distance (ft.)
20MPH
Cursor
10MPH
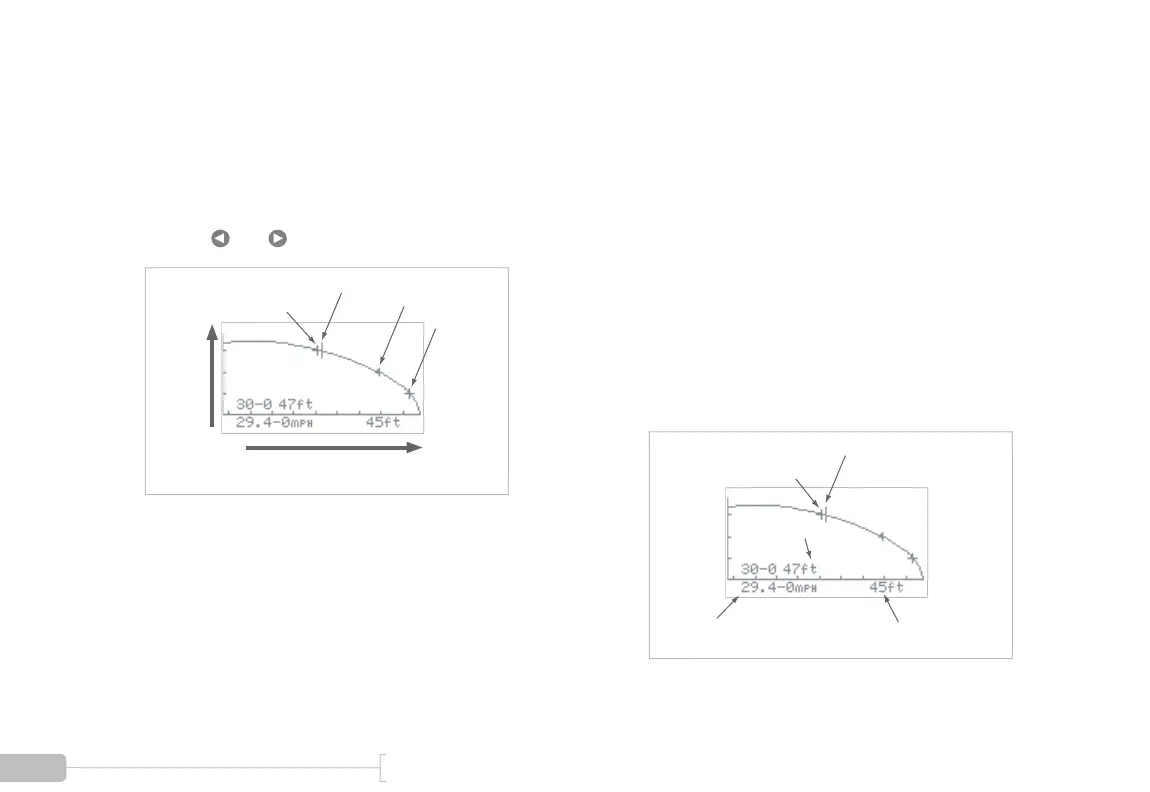
4
As the cursor is moved, the “current speed” and
“distance to stop” fields are updated. Each time the
cursor is rolled over a plus sign on the graph, the
braking milestone information is updated for that
milestone. In the following graph:
• At the cursor, “current speed” is 29.4 MPH,
and “distance to stop” is 45ft. Thus, it took 45
ft. to stop from 29.4 MPH.
• The braking milestone information indicates
that it took 47 feet to brake from 30 MPH.
Moving the cursor further to the right would
give braking distance from 20 MPH, 10 MPH,
etc.
30MPH
Cursor at 29.4 MPH
Distance to Stop
from 29.4 MPH
Current Speed
at Cursor
Braking Milestone
Information