Operation Summary
4) If the Eustachian tube opens during pressurization, the opening and clos
ing pressures will be indicated in the summary data.
5) If the Eustachian tube doesn’t open during pressurization, instruct the
patient to swallow some water.
The opening and closing pressures will
be indicated.
6) Press STOP to end the test and store the results in memory.
Multiple frequency 1) Press CLEAR. Press the CLEAR ALL softkey to ensure the availability of
tympanometry 26 pages of memory.
(MULTIPLE Hz) 2) Press SPECIAL followed by RETURN.
3) Select test mode by pressing the MULITIPLE Hz softkey. Default test
parameters for TEST 1 of the test series are displayed above softkeys on
the LCD.
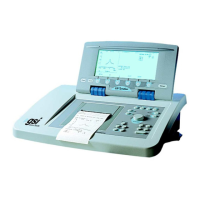
A) The GSI TympStar automatically runs a 226 Hz Y tymp to determine
the peak pressure value for the second probe frequency sweep.
B) The ADMITTANCE softkey indicates which component is measured
as a function of probe frequency at the start and peak pressures
(B
is the best component for this test).
NOTE
It may be helpful to select a sweep rate of 12.5 daPa/sec for sharply sloped
tymps.
4) Ensure that the ear canal is securely sealed.
5) Press START to initiate test.
Probe tone automatically sweeps
from 250 Hz to 2000 Hz in 50 Hz steps at start pressure.
6) Next, Y 226 Hz tymp data is collected and displayed as TEST 1 of the
series
. As in Tymp Diagnostic Mode, press HOLD at desired stopping
pressure or allow pressure sweep to continue to -400 daPa.
A) Tymp summary data will be displayed at the right of the admittance
meter.
B) Use CURSOR if a different peak pressure value is desired.
7) Press the CONTINUE softkey to initiate TEST 2 of the series. Probe tone
automatically sweeps from 250 Hz to 2000 Hz in 50 Hz steps at tymp
peak pressure.
8)
DB (or
D
Y, or
D
G, if selected) are calculated and plotted as a function of
probe frequency on upper graph display. Changes in phase of
admittance (
Dq
) as a function of probe frequency are calculated and
plotted on the lower graph.
NOTE
D
Y, B, or G values and
Dq
values are calculated as the difference between values
obtained at peak pressure versus start pressure.
GSI TympStar Version 1 and Version 2 Service Manual
3 - 29

 Loading...