67
4
Quadrant
Energy Analyzer
4
Quadrant
Energy Analyzer
SECTION 3 MENUS
E.g.:
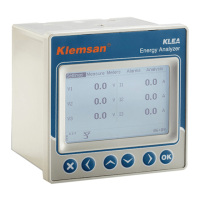
The following graph shows the averages of current signals that are calculated/measured
during the 15 minutes (demand period=15) and demand value.
Time (min)
Waveform
Amplitude
*demand period=15 minutes
average value=3 amps
demand=3A
average value=5 amps average value=4 amps
demand=5A demand=5A
15 minutes 15 minutes 15 minutes
Fig. 3-71 Demand Example
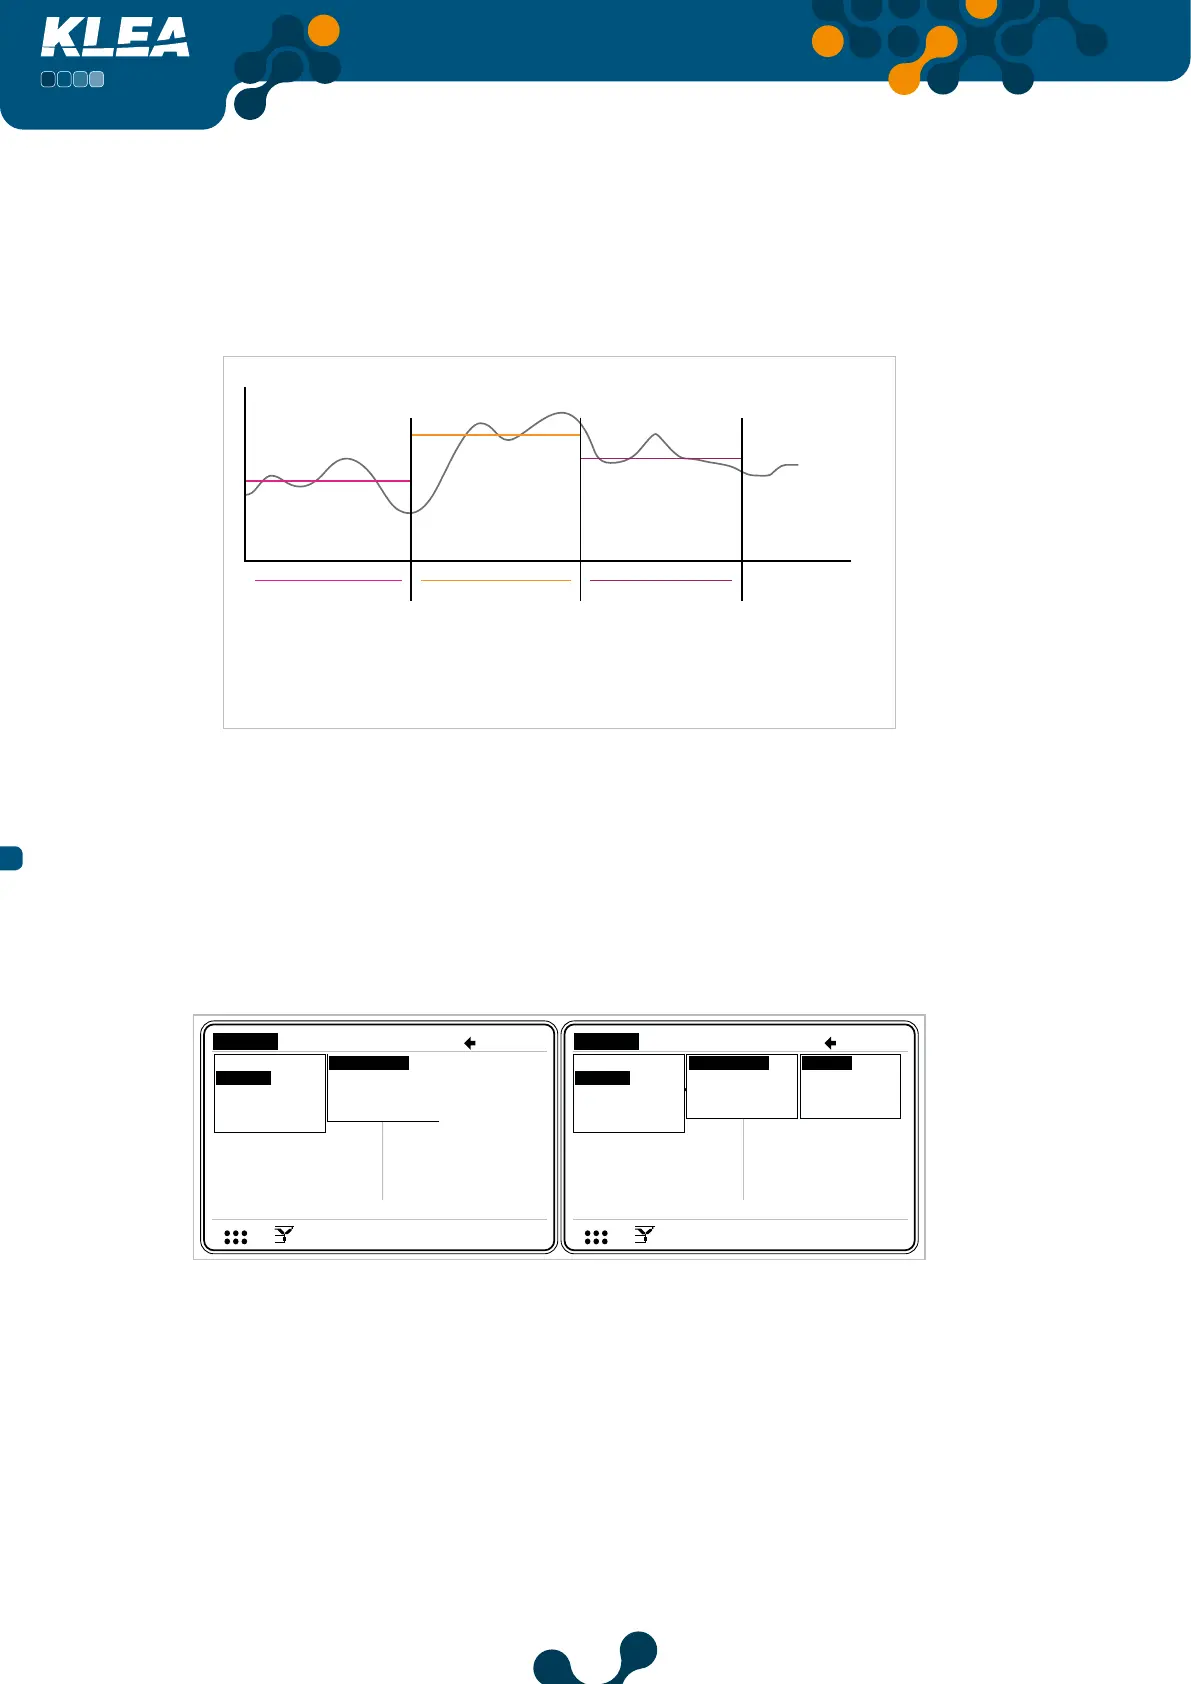
3.2.2.2.1 Current Month Menu
This menu displays demand values of current, active, reactive and apparent power of
three phases and their totals for the current (present) month.
V3
V
V
V
A
A
A
I 1
I 2
I 3
17: 2 2
0.0
220.0
220.0
0.0
5.0
5.0
V
I
1 2 3
1 2
1 2 E
Current
V3
V
V
V
A
A
A
I 1
I 2
17: 2 2
I 3
0. 0
220.0
220.0
5.0
5.0
5.0
V
I
1 2 3
1 2
1 2 E
Measure
Meters
Alarms
Analysis Measure
Meters
Alarms
Analysis
Instantaneous
Demand
Phasor diagram
Signals
Harmonics
Curr. month
1 month ago
2 months ago
3 months ago
Instantaneous
Demand
Phasor diagram
Signals
Harmonics
Curr. month
1 month ago
2 months ago
3 months ago
Act. power
Rea. power
App. power
Fig. 3-72 Current Month Menu
“Start of day” and “start of month” settings are adjusted in “Settings->Setup->Energy”
menu. “Start of day” and “start of month” are important for “Curr. Month”, “1 month
ago”, “2 months ago” and “3 months ago” submenus.