70
4
Quadrant
Energy Analyzer
4
Quadrant
Energy Analyzer
SECTION 3 MENUS
3.2.2.2.3 2 Months Ago Menu
The demand values on the 2 months ago menu are as explained in the
“Demand->Current Month” submenu.
3.2.2.2.4 3 Months Ago Menu
The demand values on the 3 months ago menu are as explained in the “Demand-
>Current Month” submenu.
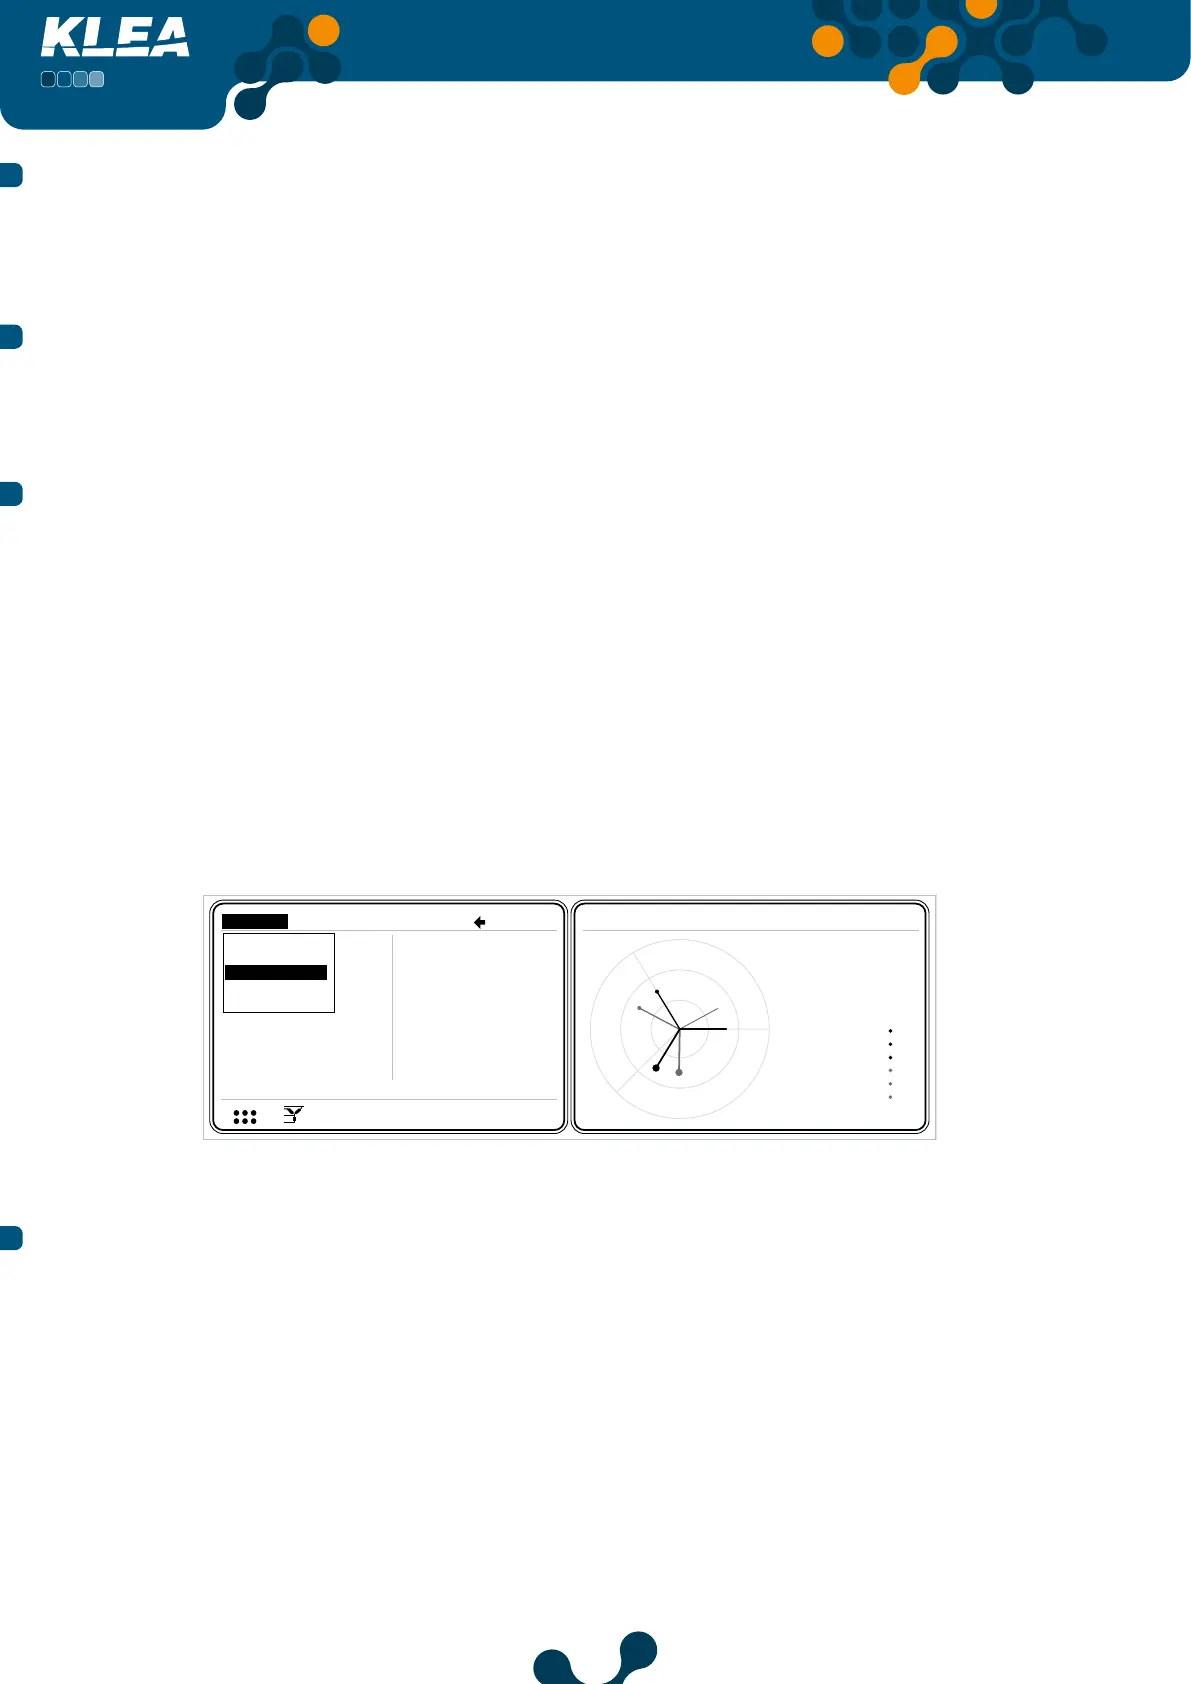
3.2.2.3 Phasor Diagram Menu
In phasor diagram menu page, at the right of the phasor diagram, following information is listed:
• phase voltages (V1, V2, V3)
• phase currents (I1, I2, I3)
• V1-V2, V2-V3 and V3-V1 phase dierence angles
• V1-I1, V2-I2 and V3-I3 phase dierence angles
Within the phasor diagram, currents are drawn with gray lines, and voltages are drawn with
black lines.
Within the phasor diagram, same size circles have been added to the ends of lines belonging
to the same phase. Thus, it will be easy to follow currents and voltages of a phase.
V2
V3
V
V
V
A
A
A
I 1
I 2
I 3
17:22
150.2
150.0
3.0
3.0
3.0
V
I
1 23
12
12 E
Measure Meters Alarms Analysis
150.1
Instantaneous
rmonics
Demand
Phasor diagram
Signals
Measure->Phasor diagram
V1
VV2 150.2
VV3 150.0
I1
I2
AI3
V1-V2 120.9
3.0
V2-V3 119.6
V3-V1 119.5
V1-I1 29.4
V2-I2 29.3
V3-I3 29.7
Ha
Fig. 3-75 Phasor Diagram Menu
3.2.2.4 Signals Menu
In this menu, current and voltage waveforms are shown. At the right hand side of the
waveforms, following information is listed:
• Voltage and current values of phases
• Instantaneous frequency value
• Phase dierence between current and voltage
Current signal is in gray, and voltage is in black color. Operator can scroll inside signals
menu by pressing left and right keys.
 Loading...