72
4
Quadrant
Energy Analyzer
4
Quadrant
Energy Analyzer
SECTION 3 MENUS
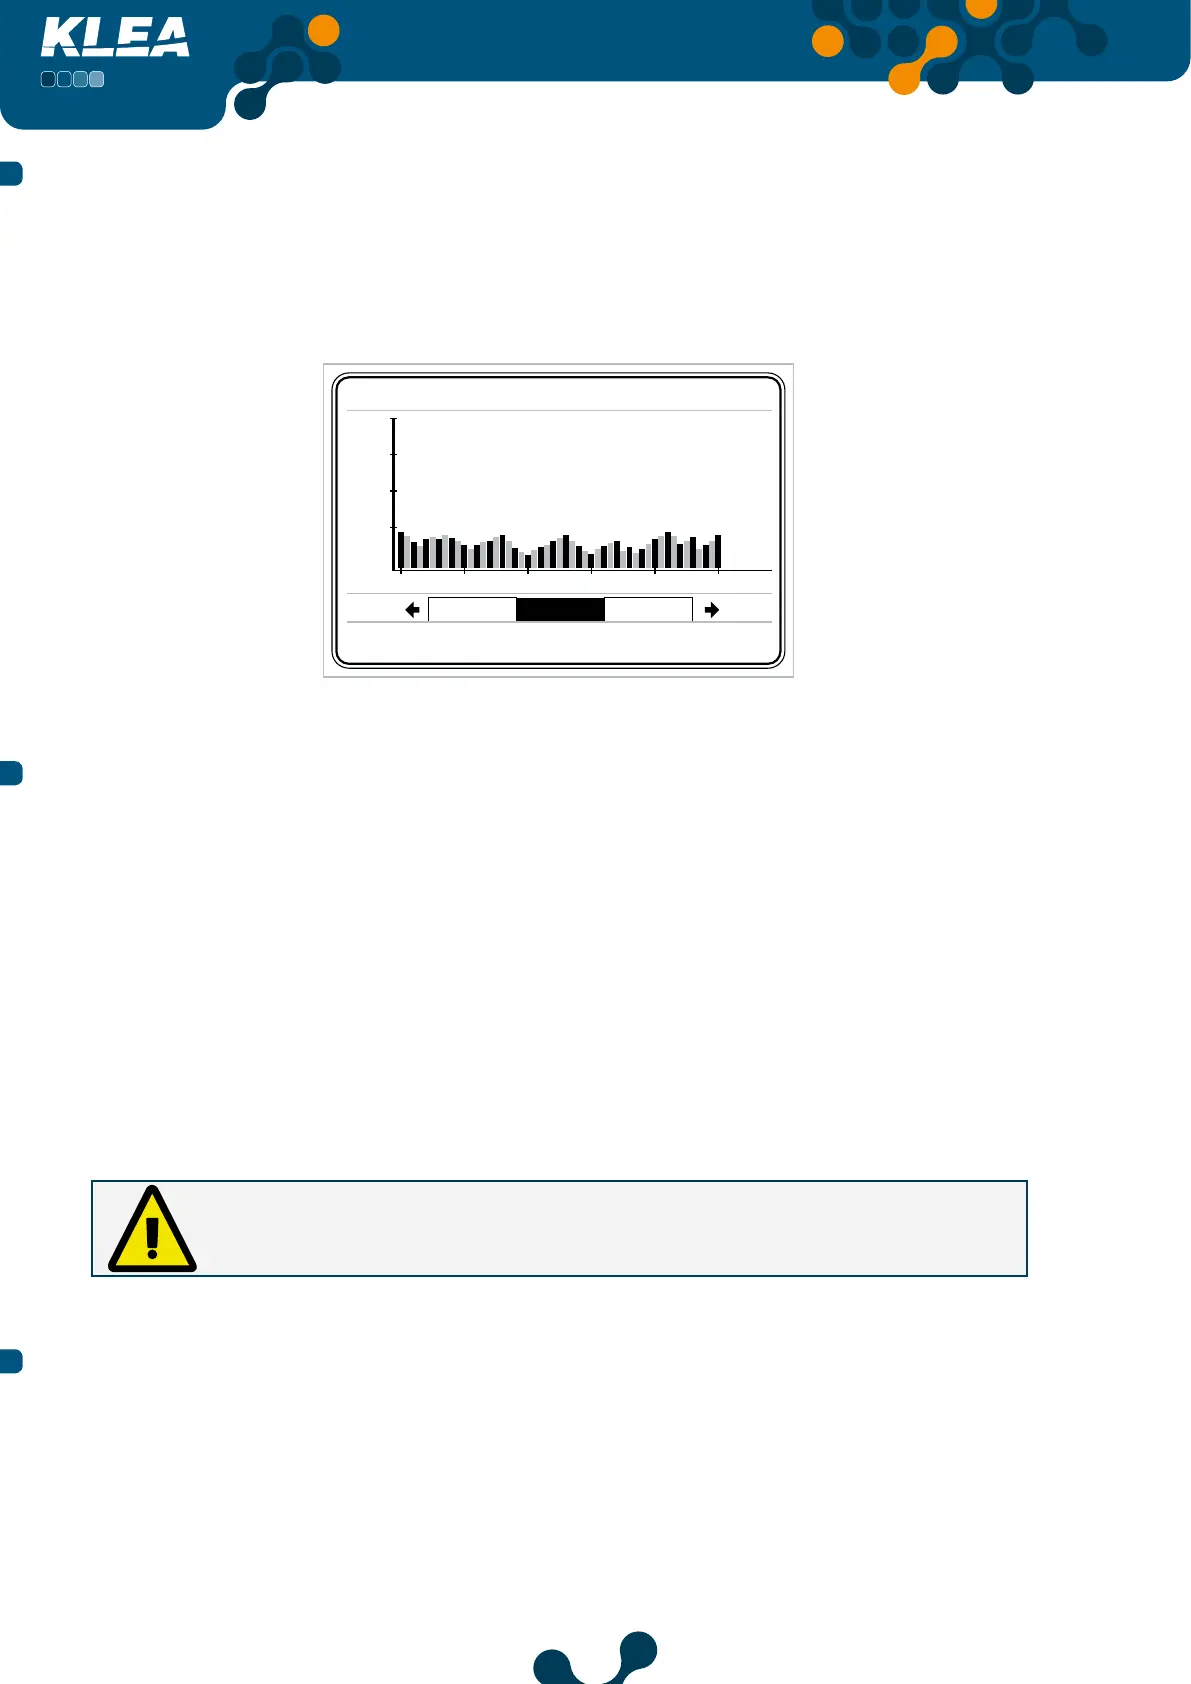
3.2.2.5.2 Graph Menu
Current and voltage harmonics of each phase are displayed graphically (Refer to Fig. 3-78).
Operator can scroll inside graph menu by pressing right and left keys. There are 6
graph pages: V1, V2, V3, I1, I2, I3.
Measure->Harmonics->V1 %
20 %
15 %
10 %
5 %
1 2111 31 41 51
I3 % V1 % V2 %
Fig. 3-79 Harmonics in Graphical Format
3.2.3 Meters Menu
In this menu, the energy values of Tariff 1 and Tariff 2 me ers are displayed:
• Imp. active
• Exp. active
• Reactive R1
• Reactive R2
• Reactive R3
• Reactive R4
• Digital input
• Other
When an energy meter reaches the value “50000000.0 Mega”, it will start to count
from “0.0”.
3.2.3.1 Imp. Active Menu
Imp. active meter consist of “ T1” , “T1 Rate1” , “T1 Rate2” , “T1 Rate3” and “T2” energy
values.