68
4
Quadrant
Energy Analyzer
4
Quadrant
Energy Analyzer
SECTION 3 MENUS
E.g.:
Assume that start of day is “8”, and start of month is “26”; When time is 08.00 on 26th
day of the month;
“Current month” values will be assigned as
“1 month ago” values,
“1 month ago” values will be assigned as
“2 months ago” values,
“2 months ago” values will be assigned as
“3 months ago” values.
And new values will be saved in “current month” menu.
Settings->Setup->Energy
T1_1 start time 8 hr
T1_2 start time hr16
T1_3 start time 0 hr
Start of day hr8
1Start of month
T1 kWh kWh1000.0
T1 kWh E kWh1000.0
T1 kVARh Imp. I. 1000.0 kVArh
T1 kVARh Imp. C. 1000.0 kVArh
T1 kVARh Exp. I. kVArh1000.0
T1 kVARh Exp. C. 1000.0 kVArh
T2 kWh 1000.0
kWh
Fig. 3-73 Example of Current Month Menu
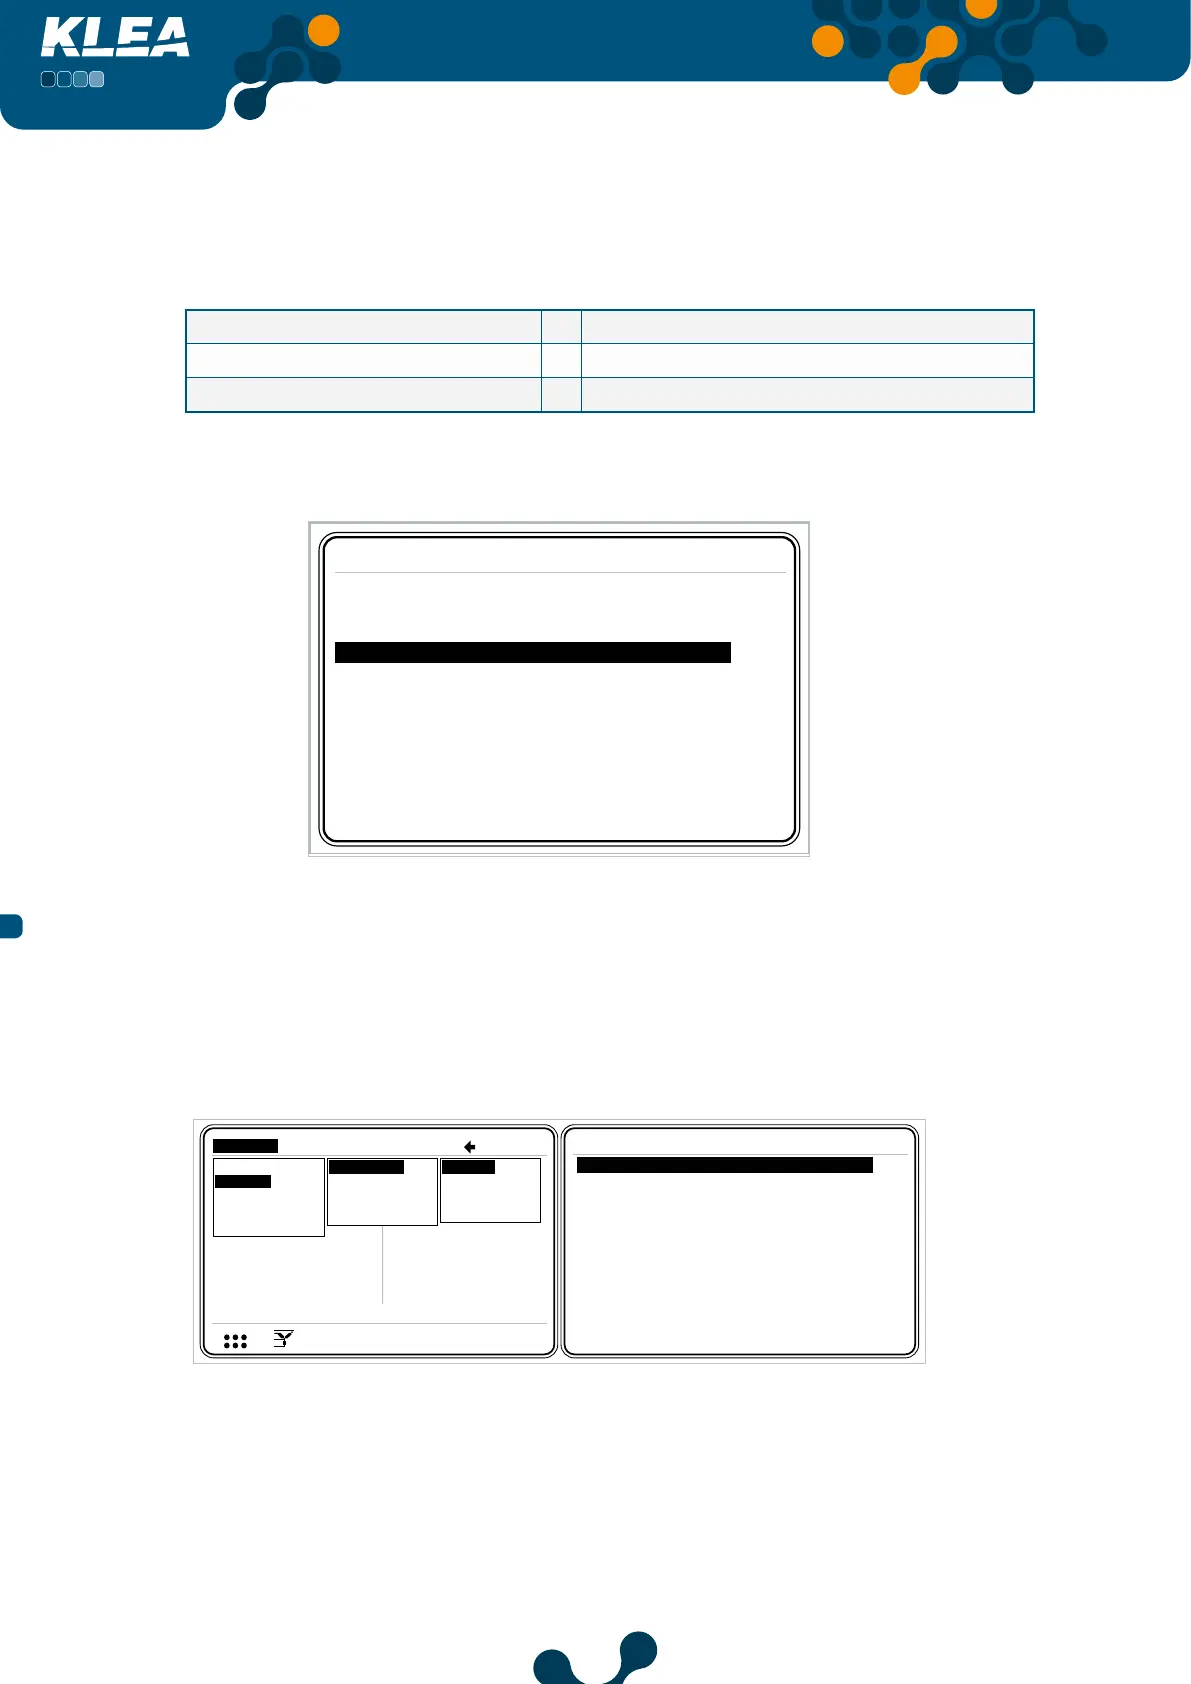
3.2.2.2.1.1 Current Menu
This menu shows demand values of currents of each phase and the demand value for
the sum of phase currents. Date and time information for demand values can be seen
on the screen.
V3
V
V
V
A
A
A
I 1
I 2
17: 2 2
I 3
220.0
220.0
0. 0
5.0
5.0
V
I
1 2 3
1 2
1 2 E
Measure
Meters
Alarms
Analysis
Instantaneous
V1
Demand
Phasor diagram
Signals
Harmonics
Curr. month
2 month ago
3 month ago
Current
Measure->Demand->Curr month ->Current
Phase1 A
Phase2 A
Phase3 A
AToplam
5.0
02:44:59 - 10/10/12
5.1
13:29:59 - 11/10/12
4.9
14:29:59 - 09/10/12
15.6
09:14:59 - 12/10/12
1 month ago Act. power
Rea. power
App. power
Fig. 3-74 Current Menu
E.g.:
Assume that demand period is entered as 15 minutes. Also assume that the current (present)
month’s‘current demand’ and date are: Phase1 5.0 A 02:44:59 - 10/10/12.
 Loading...