Fresh Gas Flow Display System Interface
3 - 12 046-004667-00 A7™ Operating Instructions
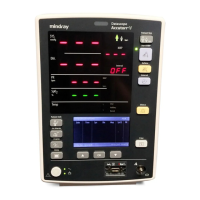
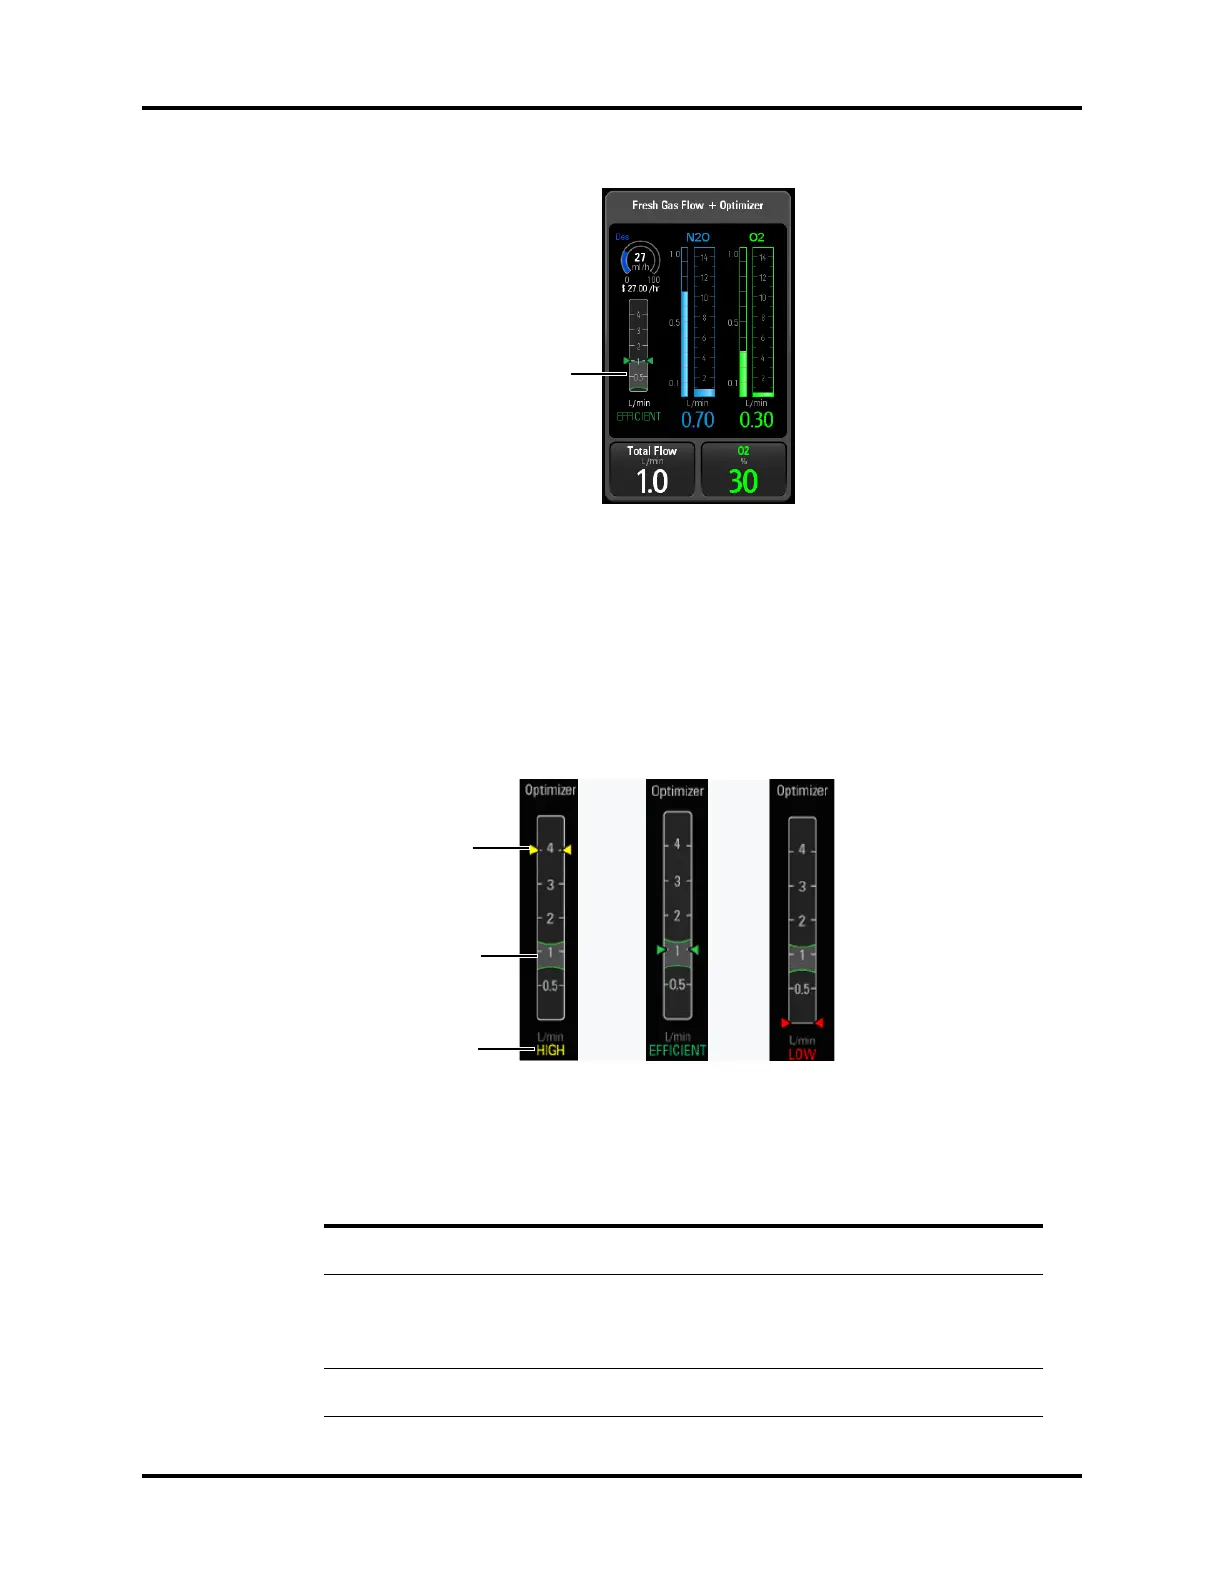
FIGURE 3-18
OPTIMIZER®
The triangle indicator on the
OPTIMIZER® display shows the real-time total fresh gas flow delivery. The
"efficient" range (1 L/min wide) is also shown (FIGURE 3-18).
If the indicator is above the efficient area, the OPTIMIZER® will indicate a HIGH with text and indicator
in yellow. If the indicator is located at the efficient area, the OPTIMIZER® will indicate an EFFICIENT
with text and indicator in green. If the indicator is under the efficient area, the OPTIMIZER® will indicate
a LOW with text and indicator in red.
FIGURE 3-19
OPTIMIZER® Indication States
INDICATION INDICATION COLOR MEANING
HIGH Yellow Total fresh gas delivery is more than 1 L/min above the gas
consumption (leak+uptake).
EFFICIENT Green Total fresh gas delivery is efficient.
NOTE: EFFICIENT does not imply clinical
efficiency.
LOW Red Total fresh gas delivery is less than the gas consumption
(leak+uptake).
TABLE 3-1 Indication
Efficient Area
Triangle indicator,
showing total fresh
gas delivered
Efficient area
Tex t