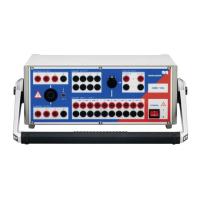
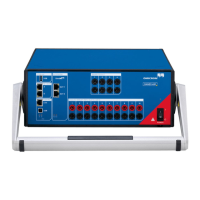
OMICRON 123
Test cards for Advanced CT Test mode
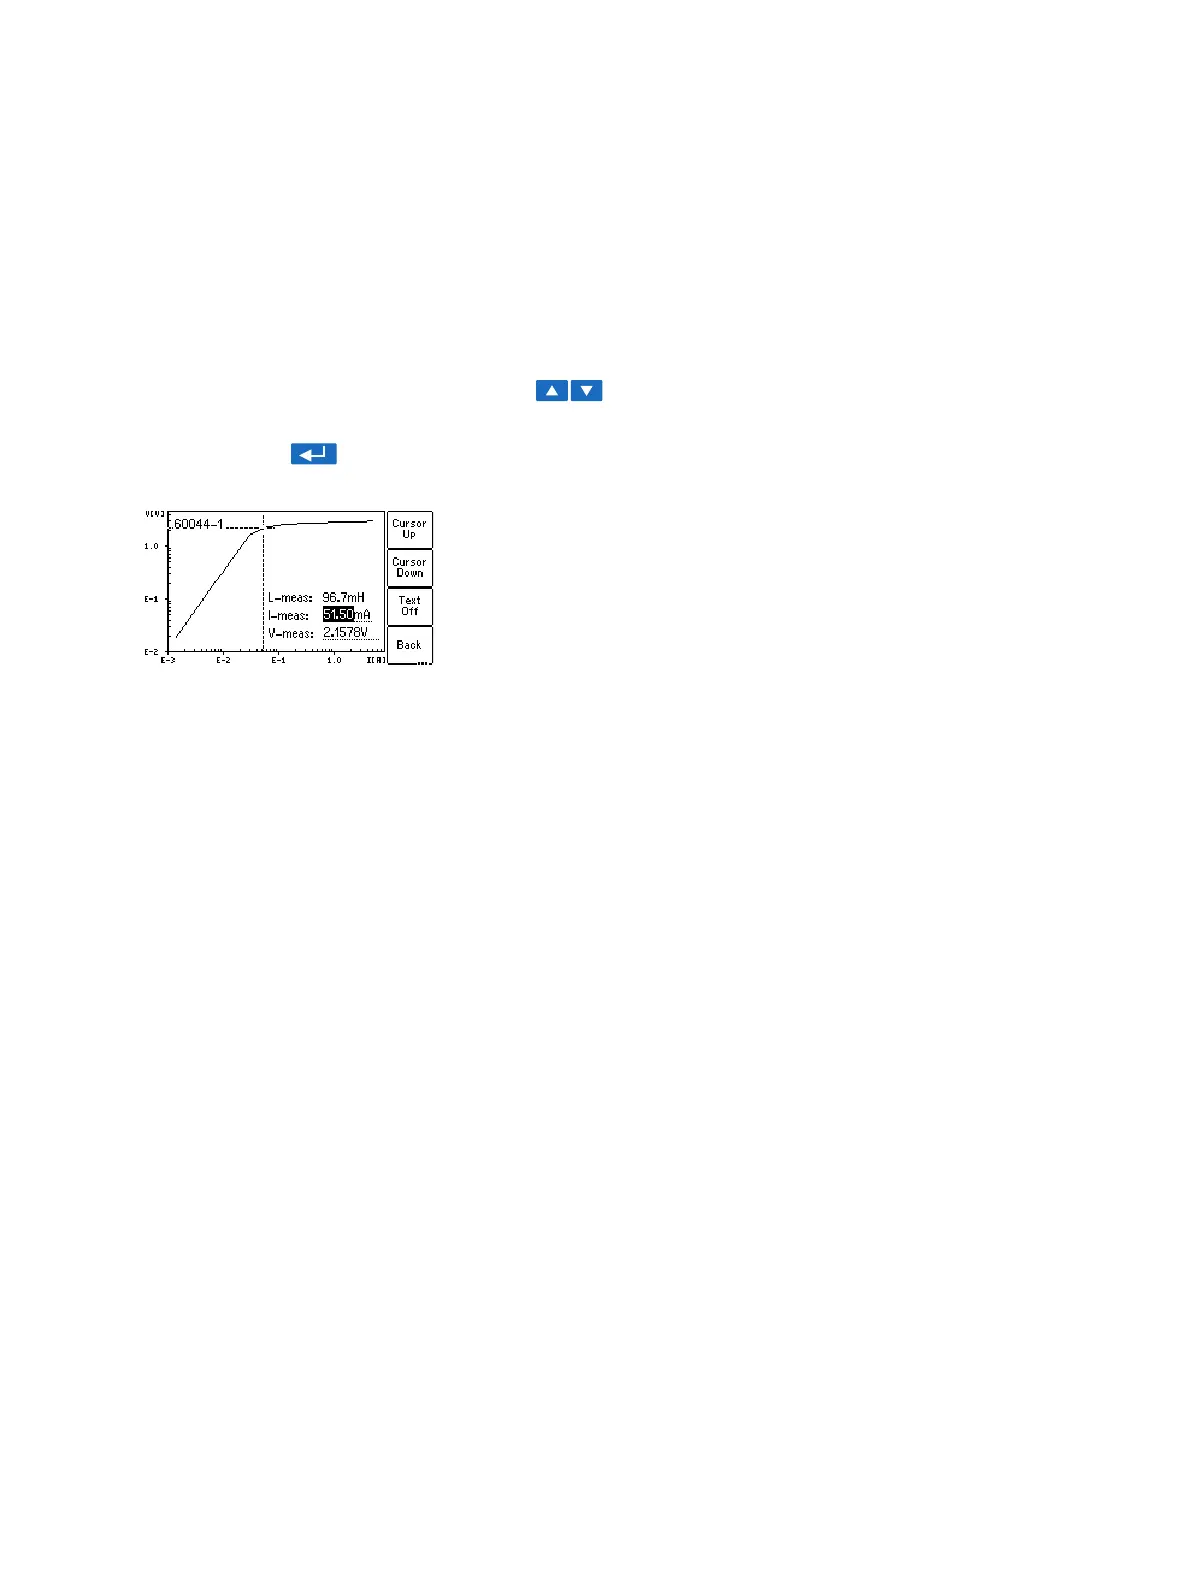
Viewing the measured values for different points on the graph
By default, the knee point values are displayed after opening the excitation graph page. However, you
can also view the corresponding voltage, current and inductance values for any point on the graph. To
select a specific point on the graph,
► either use the soft keys (Cursor Up, Cursor Down, Knee Point)
► or enter a specific voltage or current value using the keyboard:
► Select the desired edit field using the cursor keys.
► Enter the desired voltage or current value using the keyboard.
► Press the key to apply the entered value and read the corresponding values in the
respective fields (e.g. "V-meas" and "L-meas" if you have entered a current "I-meas").
Figure 8-14: Entering a current value to display its corresponding voltage and inductance values on the
excitation graph