Appendix C
A-109
To use the signal analysis function:
1. From the VT100 screen, select
SIG. ANAL.
The Signal Analysis screen is displayed:
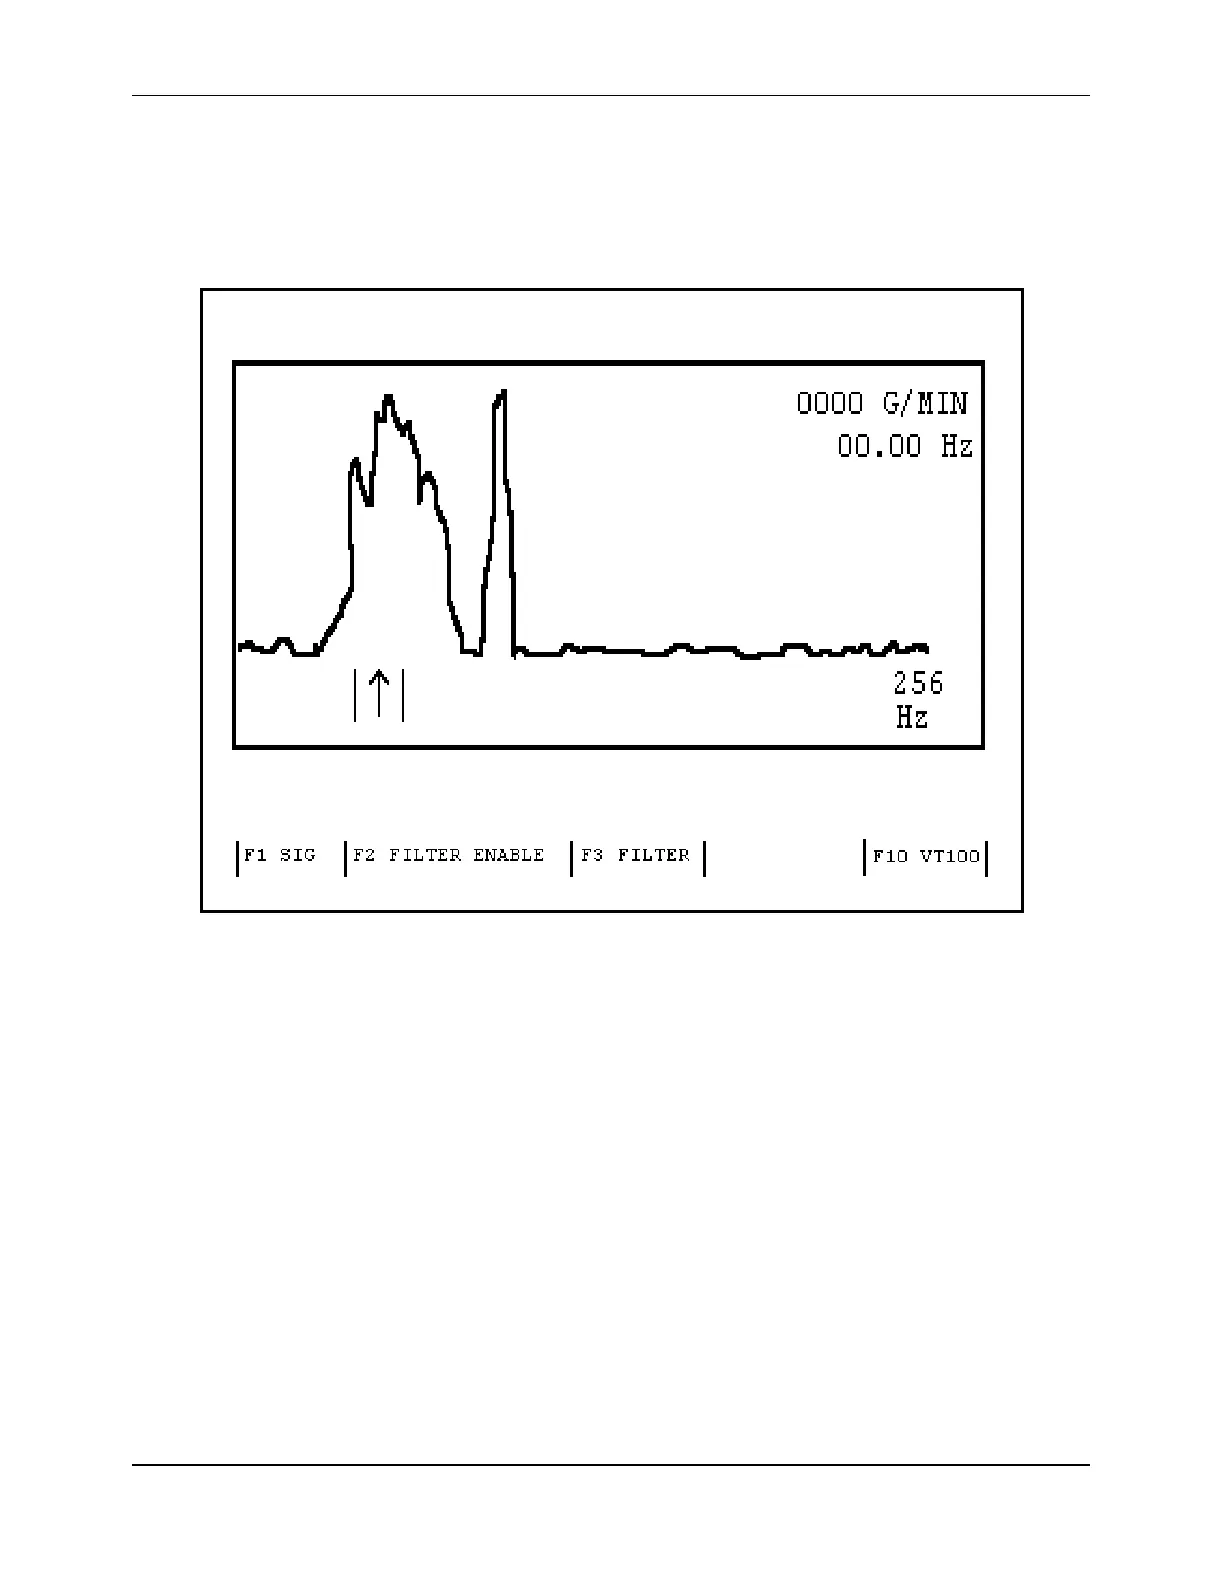
Figure A-9 Signal Analysis Screen (with Interference Present)
In the example displayed in Figure A-9, the desired signal appears as a typical bell-shaped
curve on the left. An isolated peak near the center of the display has been identified as an
interference signal. The median point of the signal appears in the upper right corner of the
display and is indicated at the bottom of the display by a small arrow.
2. If the filter is currently disabled, select
FILTER ENABLE.
3. Select FILTER.
Two brackets are displayed as thin vertical lines on the screen (Figure A-10). These
brackets are used to define filters for eliminating interference frequencies from the
signal spectrum.
NOTE:
Select a specific bracket by pressing the
UP ARROW
key. Move the selected
bracket by pressing the
RIGHT
and
LEFT
ARROW
keys. Select fine or coarse
bracket movement by pressing the
DOWN
ARROW
key.