94
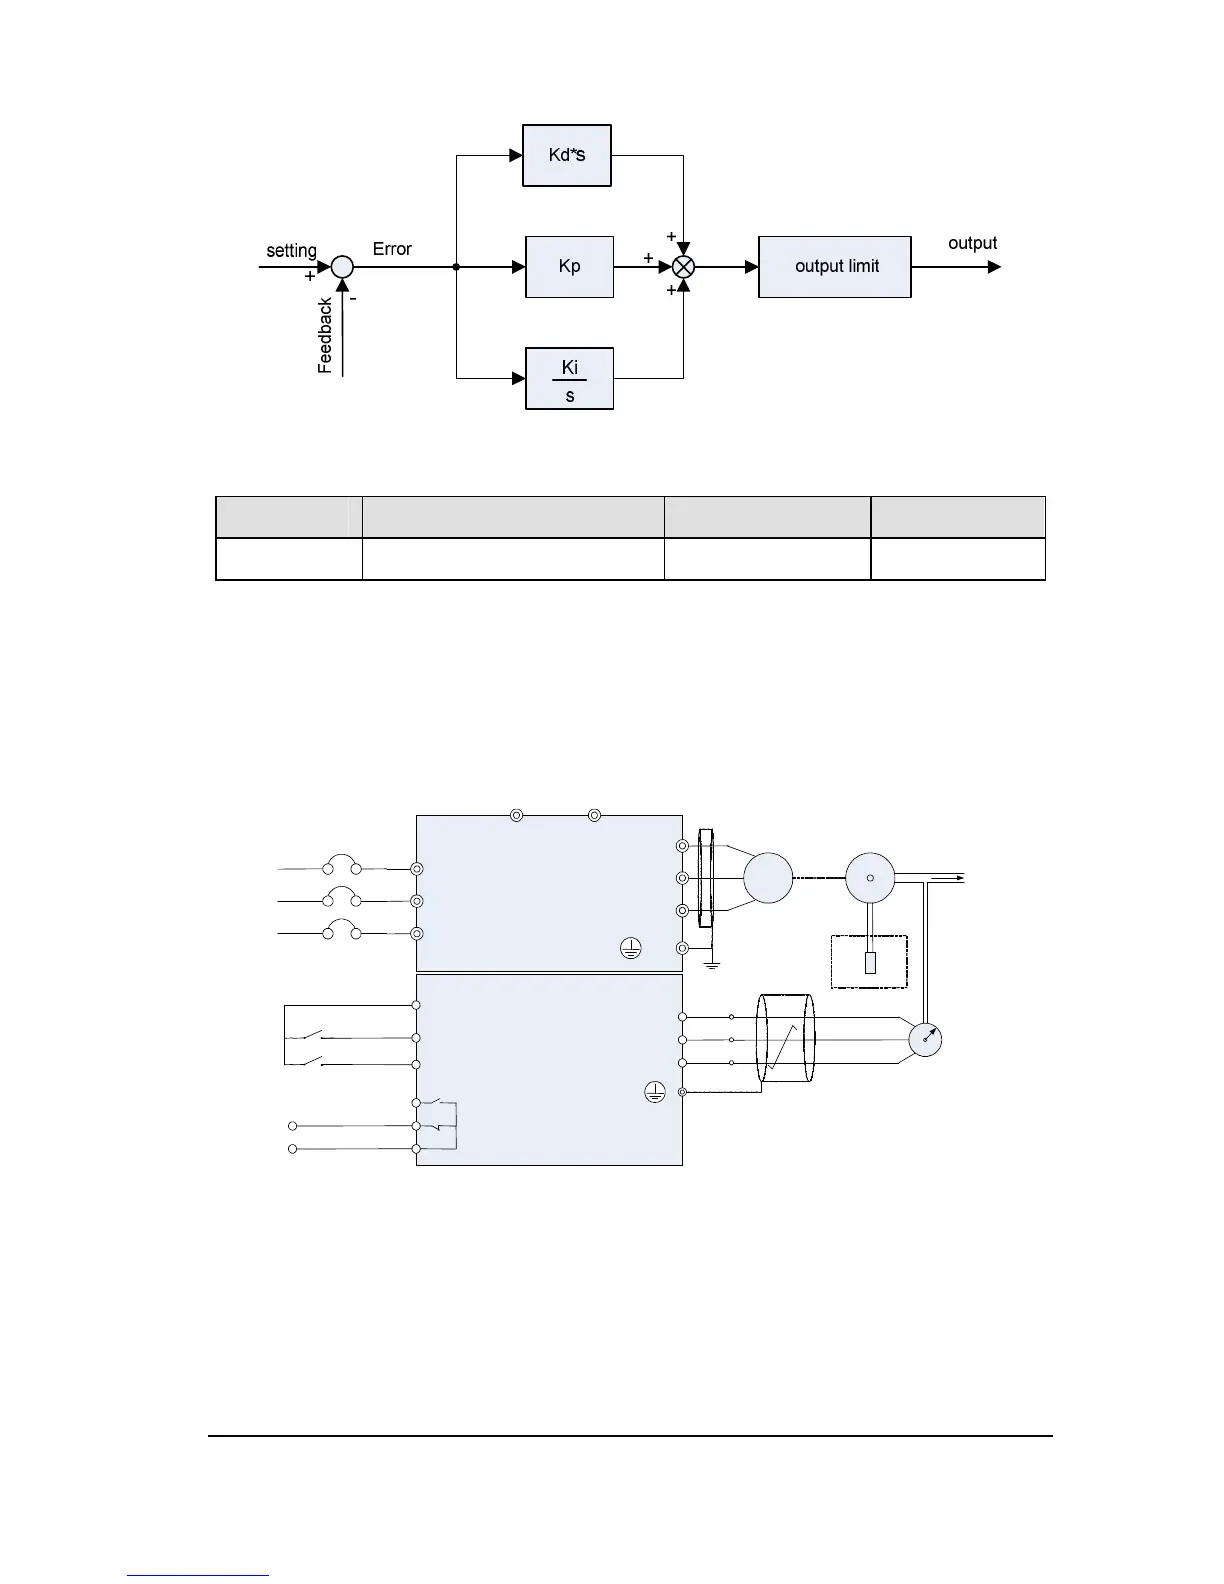
Figure 2.37 Block diagram of built-in PID controller
NO. Parameter Name Setting Range Default
f900 PID control 0~2 0
0: Disabled
1: Enabled (Feedback: AI1)
2: Enabled (Feedback: AI2)
Note: Do not set the same value to f003 and f900.
Figure 2.38 PID wiring example
Process quantity input data (frequency or percentage term) and feedback input data can
be combined as follows for the PID control. See table 5.9.
R
 Loading...