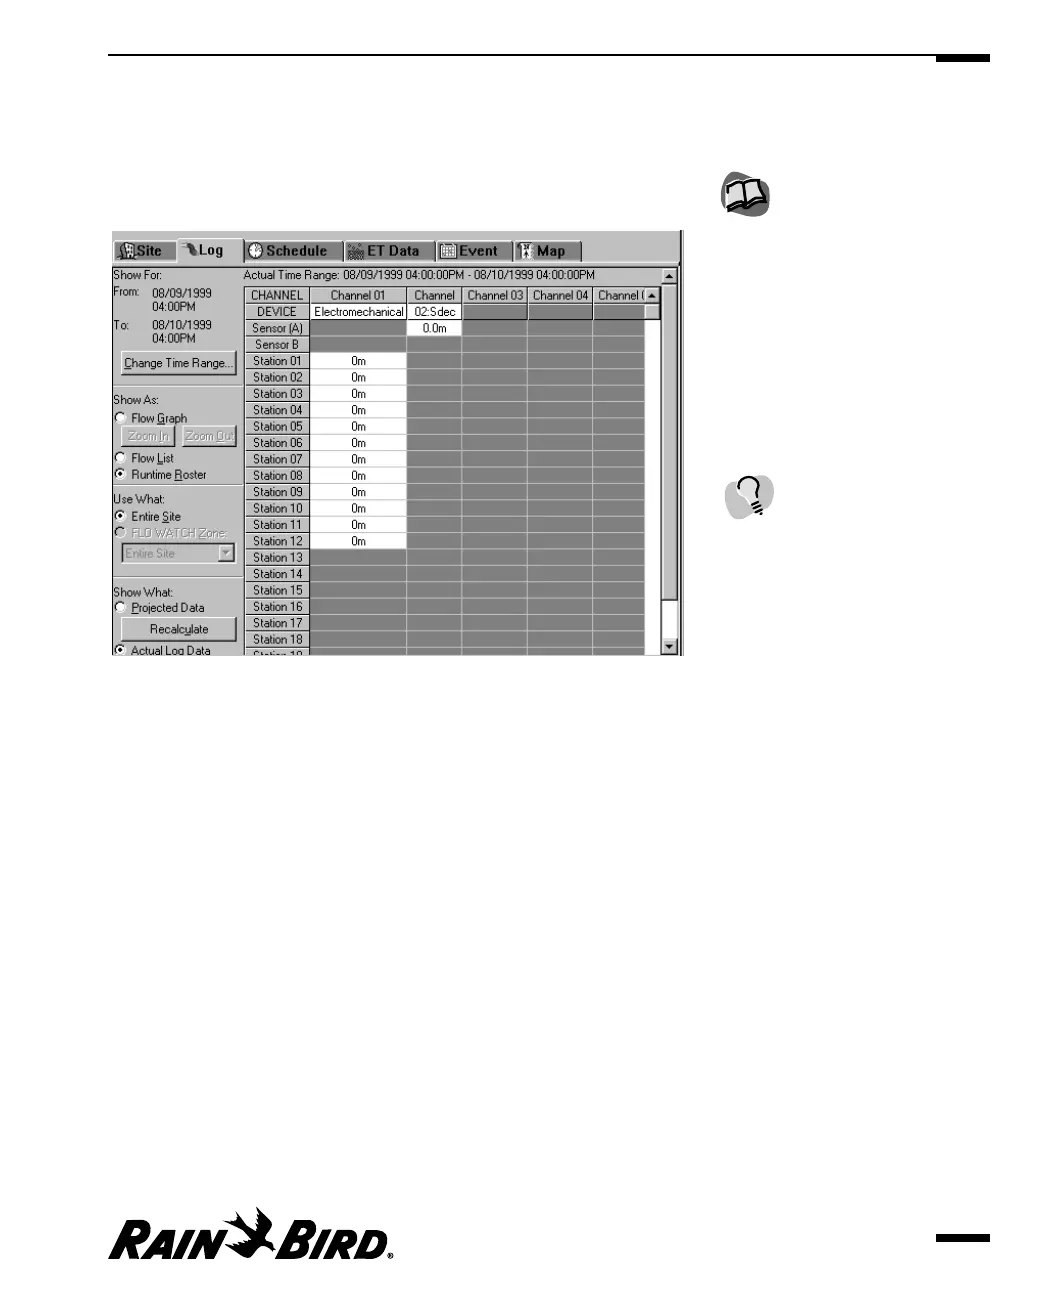
Viewing the Runtime Roster
The Runtime Roster displays flow data broken down by device, channels and
stations. Numbers displayed in red indicate that the projected data does not
match the actual data.
Runtime Roster
Viewing the Entire Site or One FLO WATCH Zone
You can select to view log data for the entire site, which includes data for all
stations at the site, or you can view data for just one FLO WATCH zone (by the
name of the zone).
To select the entire site or one FLO WATCH zone:
1
Under the Use What section, select the Entire Site or FLO WATCH Zone radio
button.
2
If you choose the FLO WATCH Zone radio button, select the name of the zone
from the drop-down list.
Viewing Actual Log Data or Projected Data
Depending upon the time range you have selected, you may wish to display
either projected data or actual log data. The area where you make this selection is
the bottom left corner of the Log sheet and is entitled “Show What.”
To select projected data and/or actual log:
Click on the Projected Data and/or Actual Log checkboxes.
Viewing and Editing Site Data
7.9
For more information, see
“Setting Site FLO WATCH
Properties” on page 4.15.
Projected data calculated for
the depiction area takes into
account all linked schedules
and other complexities prior
to displaying the data.