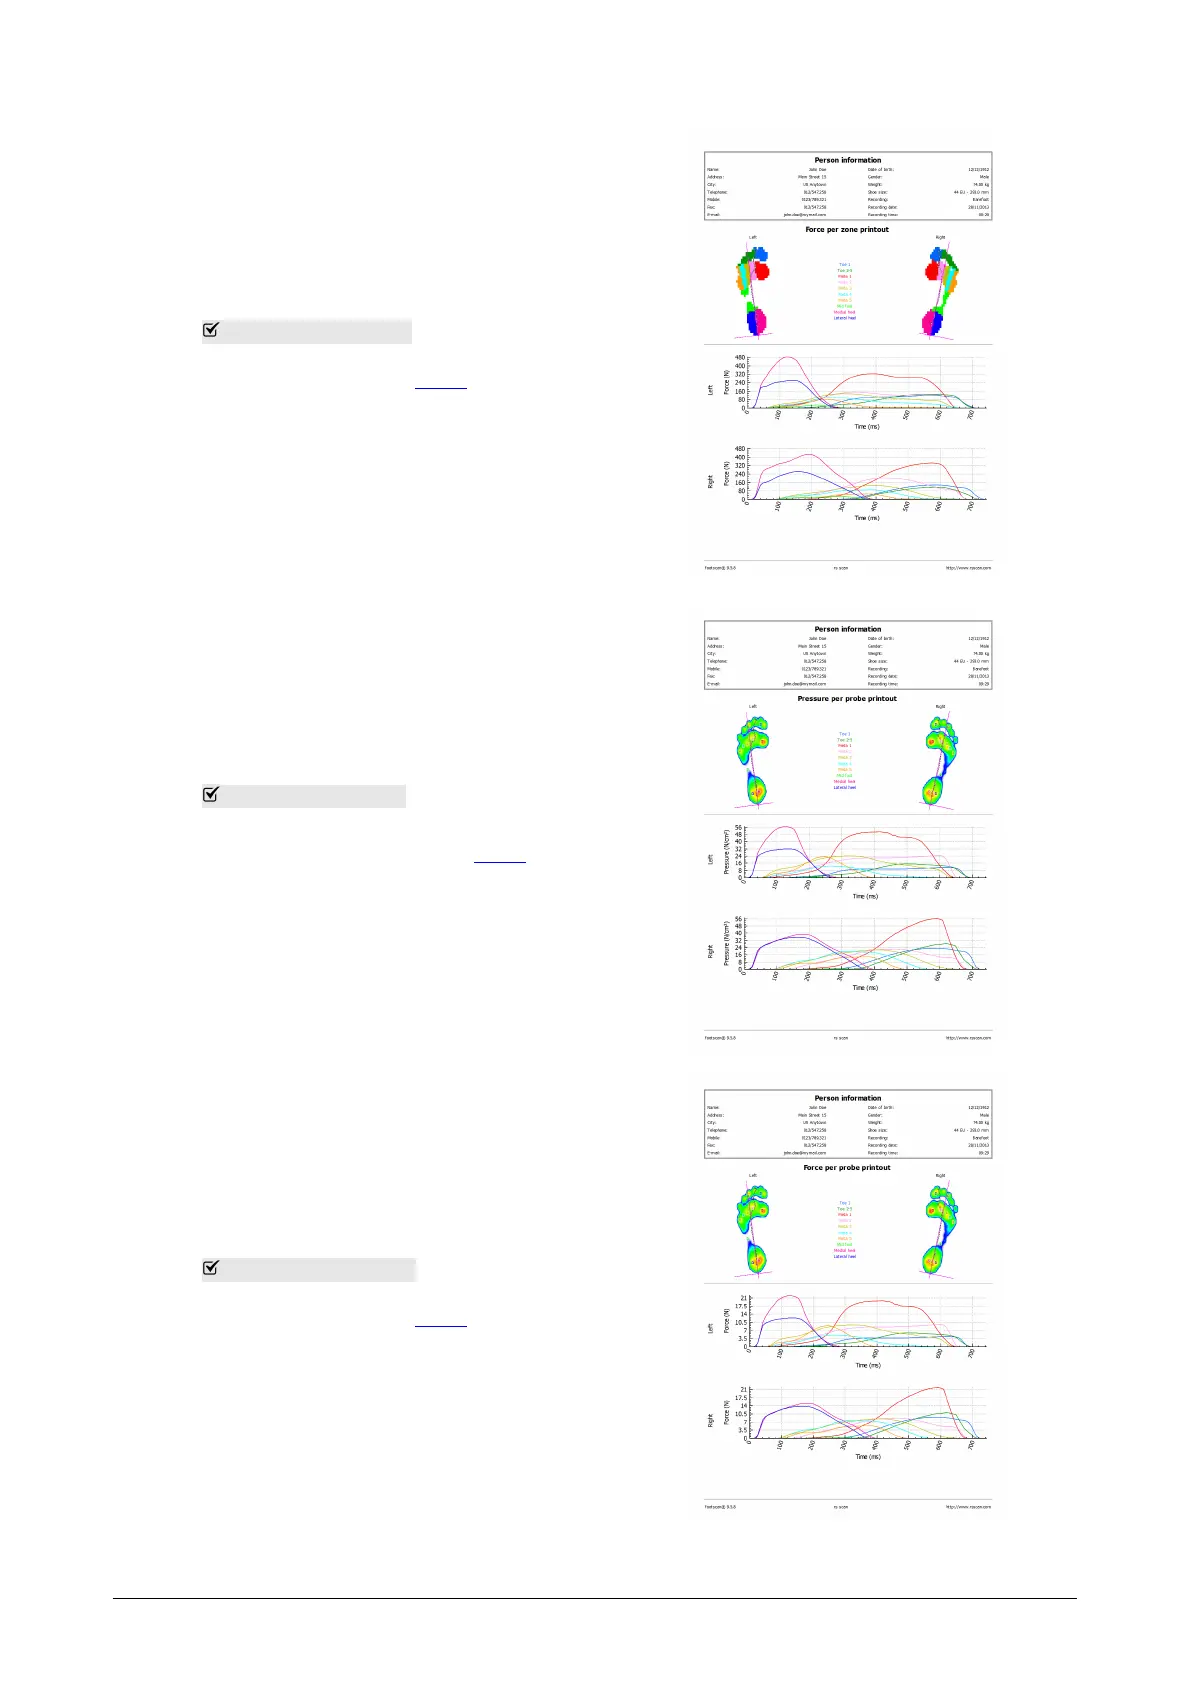
Total force per zone Plots the graphs of
the force (N) applied on each zone of the
foot selection (Section 10.10).
Pressure per probe Plots the graphs of
the pressure (
N
/
CM
2
) applied on each probe
of the foot selection (Section 10.11).
Total force per probe Plots the graphs of
the force (N) applied on each probe of the
foot selection (Section 10.11).