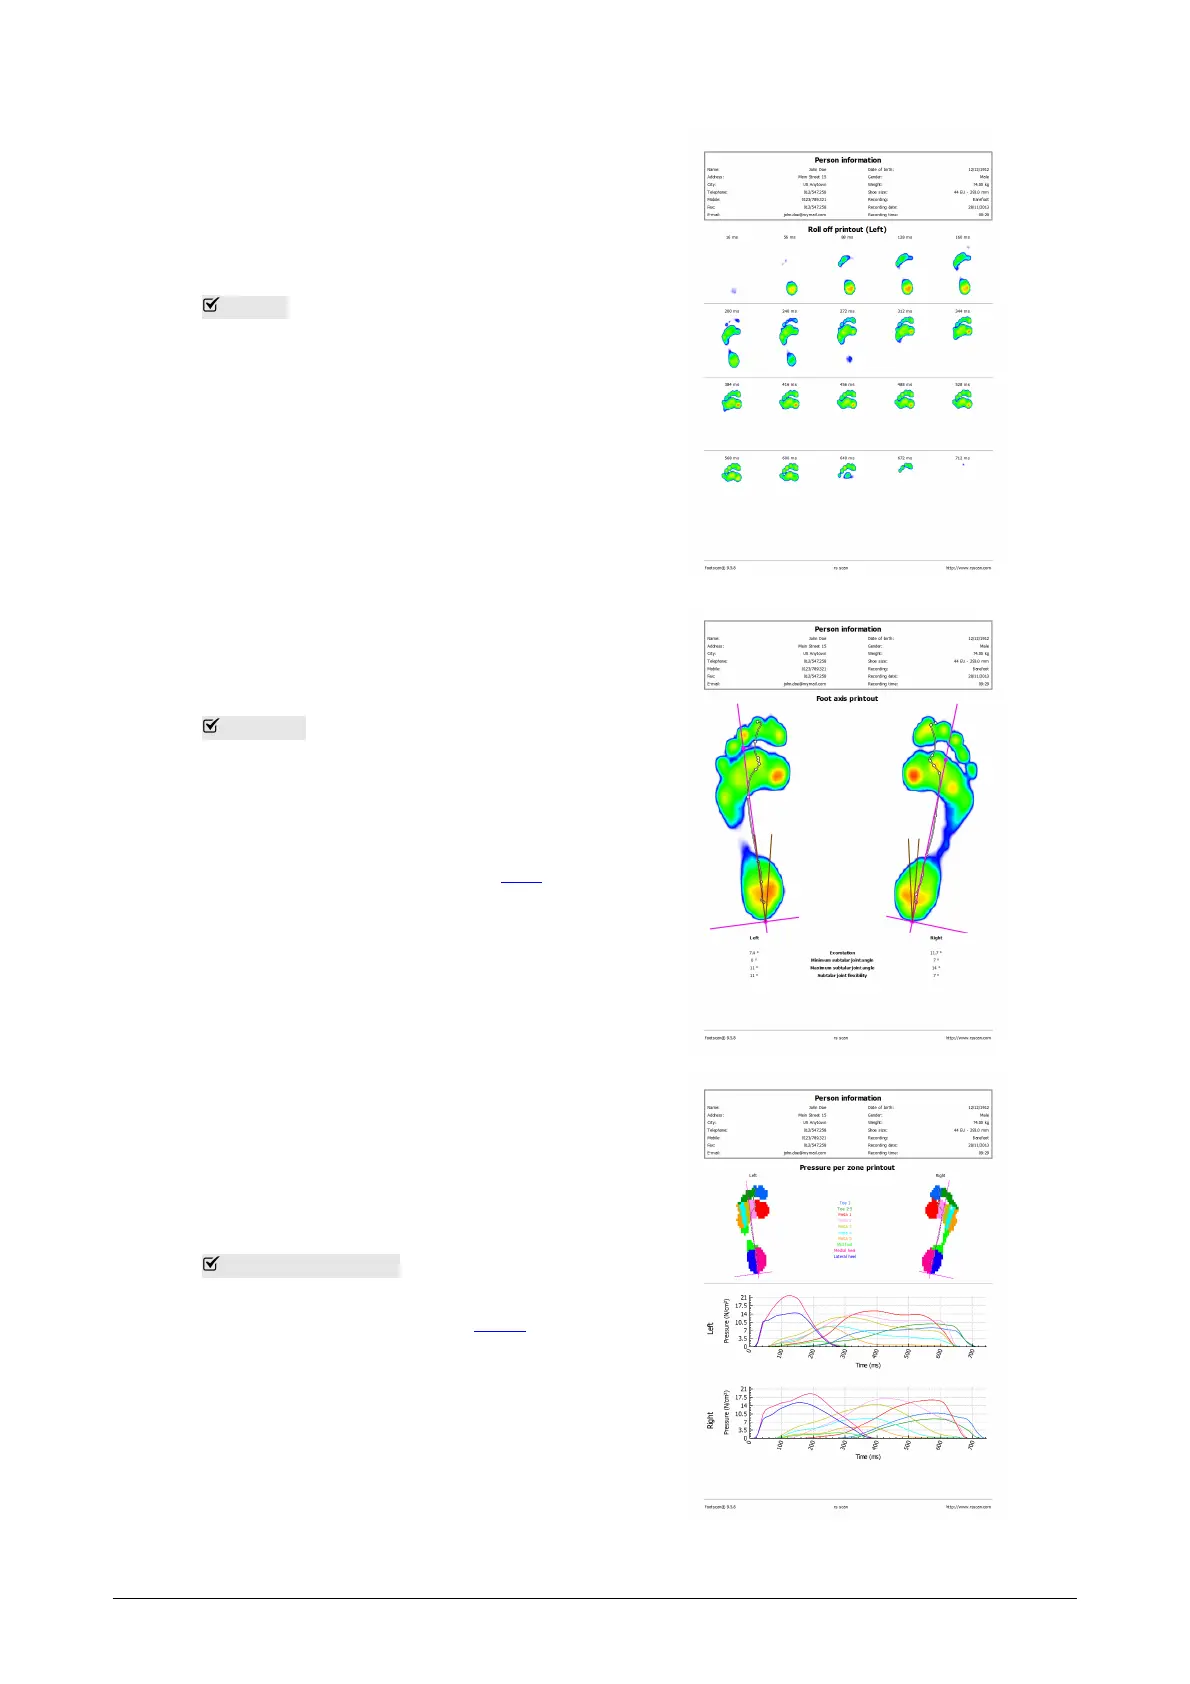
Roll off Lists a sequence of images from
the roll-offs of the foot selection, the timing
for each image is indicated in
milliseconds. Adds one page for each foot
to the report.
Foot axis Shows the maximum pressure
values of the dynamic measurement's foot
selection with the foot axes, center-of-
pressure line and subtalar joint angles.
Additionally it displays numerical
information about the exorotation and
subtalar joint angles (Section 10.7). The
foot axis report is available in the Clinical,
Scientific package(s).
Pressure per zone Plots the graphs of
the pressure (
N
/
CM
2
) applied on each zone
of the foot selection (Section 10.10).