the selected pair. Change the selection by clicking the thumbnails. The Analyze screen
updates its analyses instantaneously. Click Select feet again to hide the timeline.
When comparing two pair of feet the Analyze screen also displays a Select feet for
the second measurement (Figure 35b). Note that this button only selects the pair of feet
with which to compare. It does not affect the foot selection stored for the second
measurement.
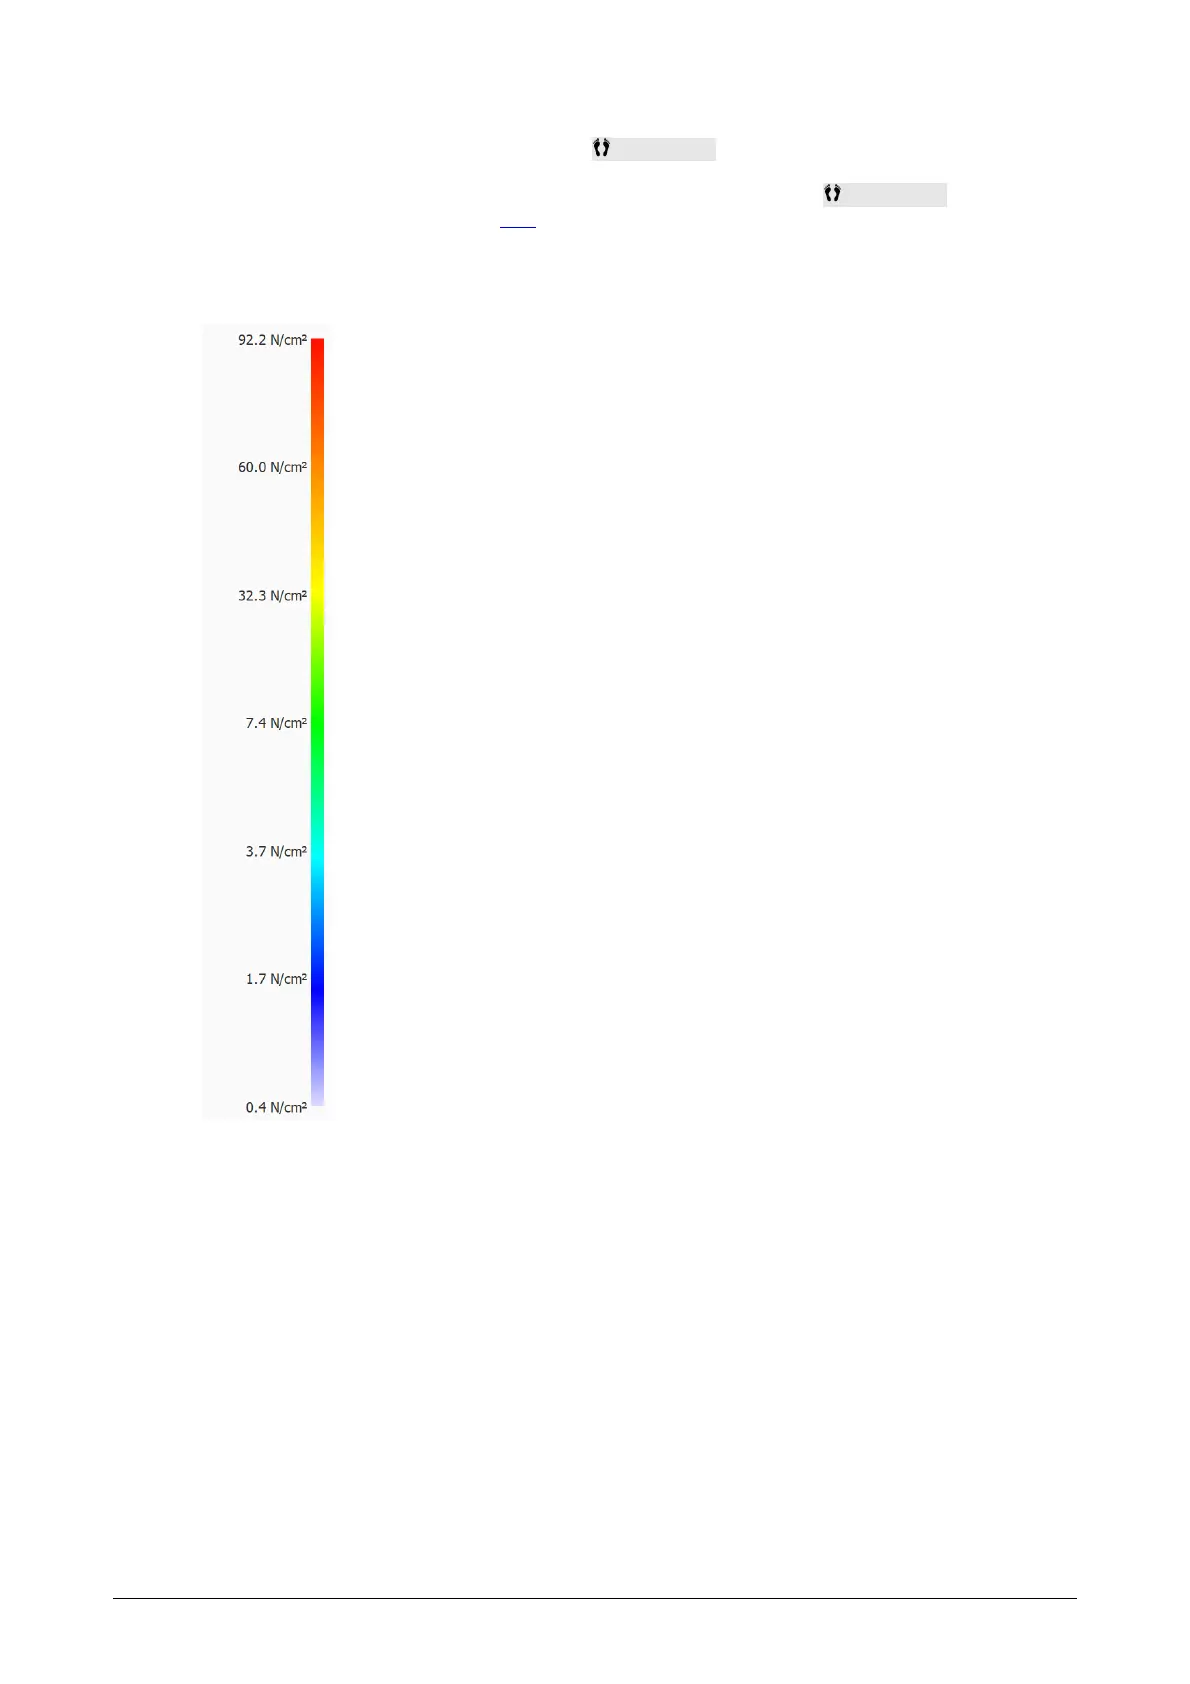
Color Scale Some analyses display physical quantities as images.
The colors in these images relate to the underlying value. The
Color scale expresses this relationship between physical quantity
and color. The color scale displays the entire color spectrum and
some key physical quantity values next to their corresponding
colors. The minimum and maximum values are at both ends of the
spectrum.