Scope Multimeter Capturing Data
126
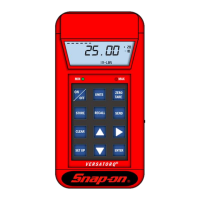
The Zoom cursor can be used to mark the approximate position of a glitch and can
be manually dragged onscreen to the desired position. The new cursor position will
be centered on the screen when a lower magnification level is selected.
Figure 12-36 shows an example at Max with the Zoom cursor positioned in the area
of a signal drop glitch.
1. Glitch
2. Zoom Icon
3. Zoom Magnification Level (Max shown)
4. Zoom Cursor
Figure 12-36
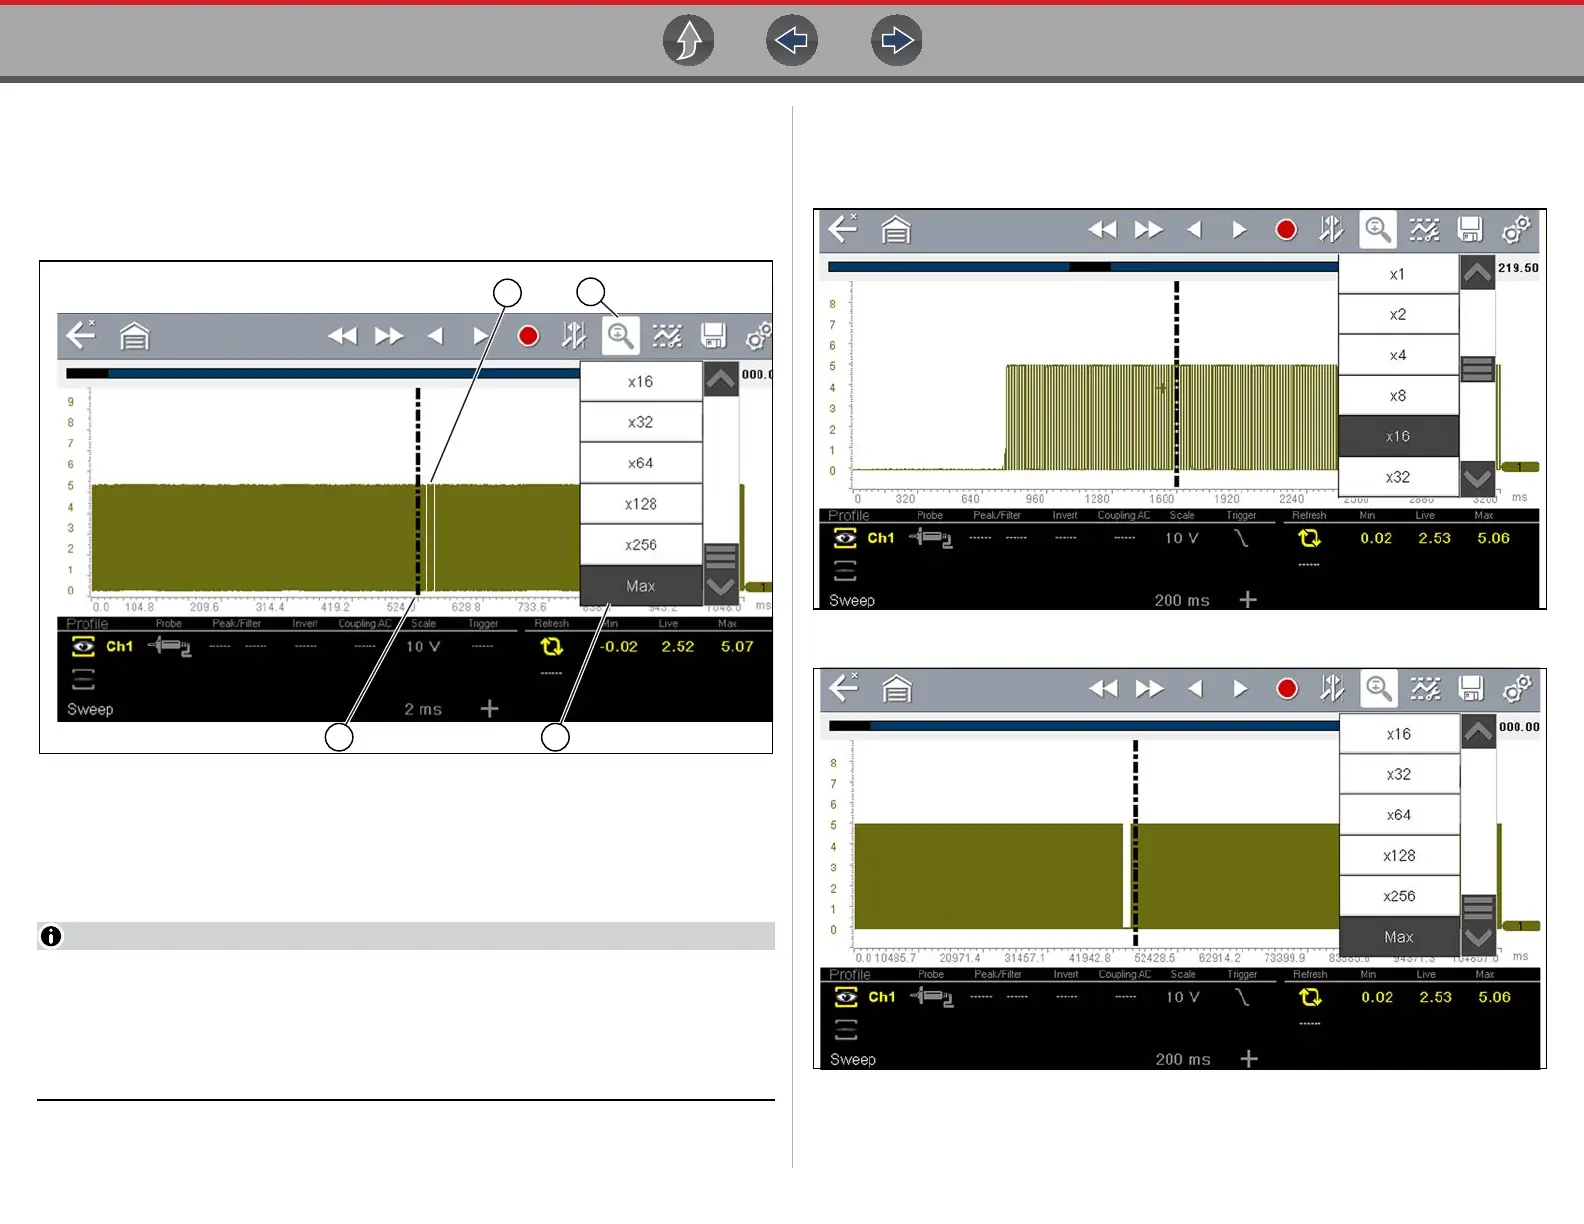
To quickly identify a glitch in a pattern, it may be easier to initially view the
waveform at a higher magnification level (e.g. 256X or "Max") to display the
entire captured waveform, find the area of interest and then lower the zoom
level to 8X or 2X to review that area in detail. See the following figures and the
Zoom Example on page 127.
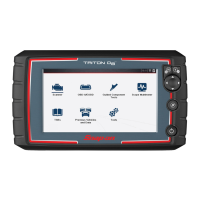
Figure 12-37 shows an example at 16X of the same waveform shown in
Figure 12-38. In Figure 12-37 at 16X, the glitch is easily seen as compared to
higher magnification levels.
Figure 12-37
Figure 12-38
 Loading...