DMS-1200 Release 6 Operations Manual
Section 9 – Trend Data, Event Logs and System Inventory 94
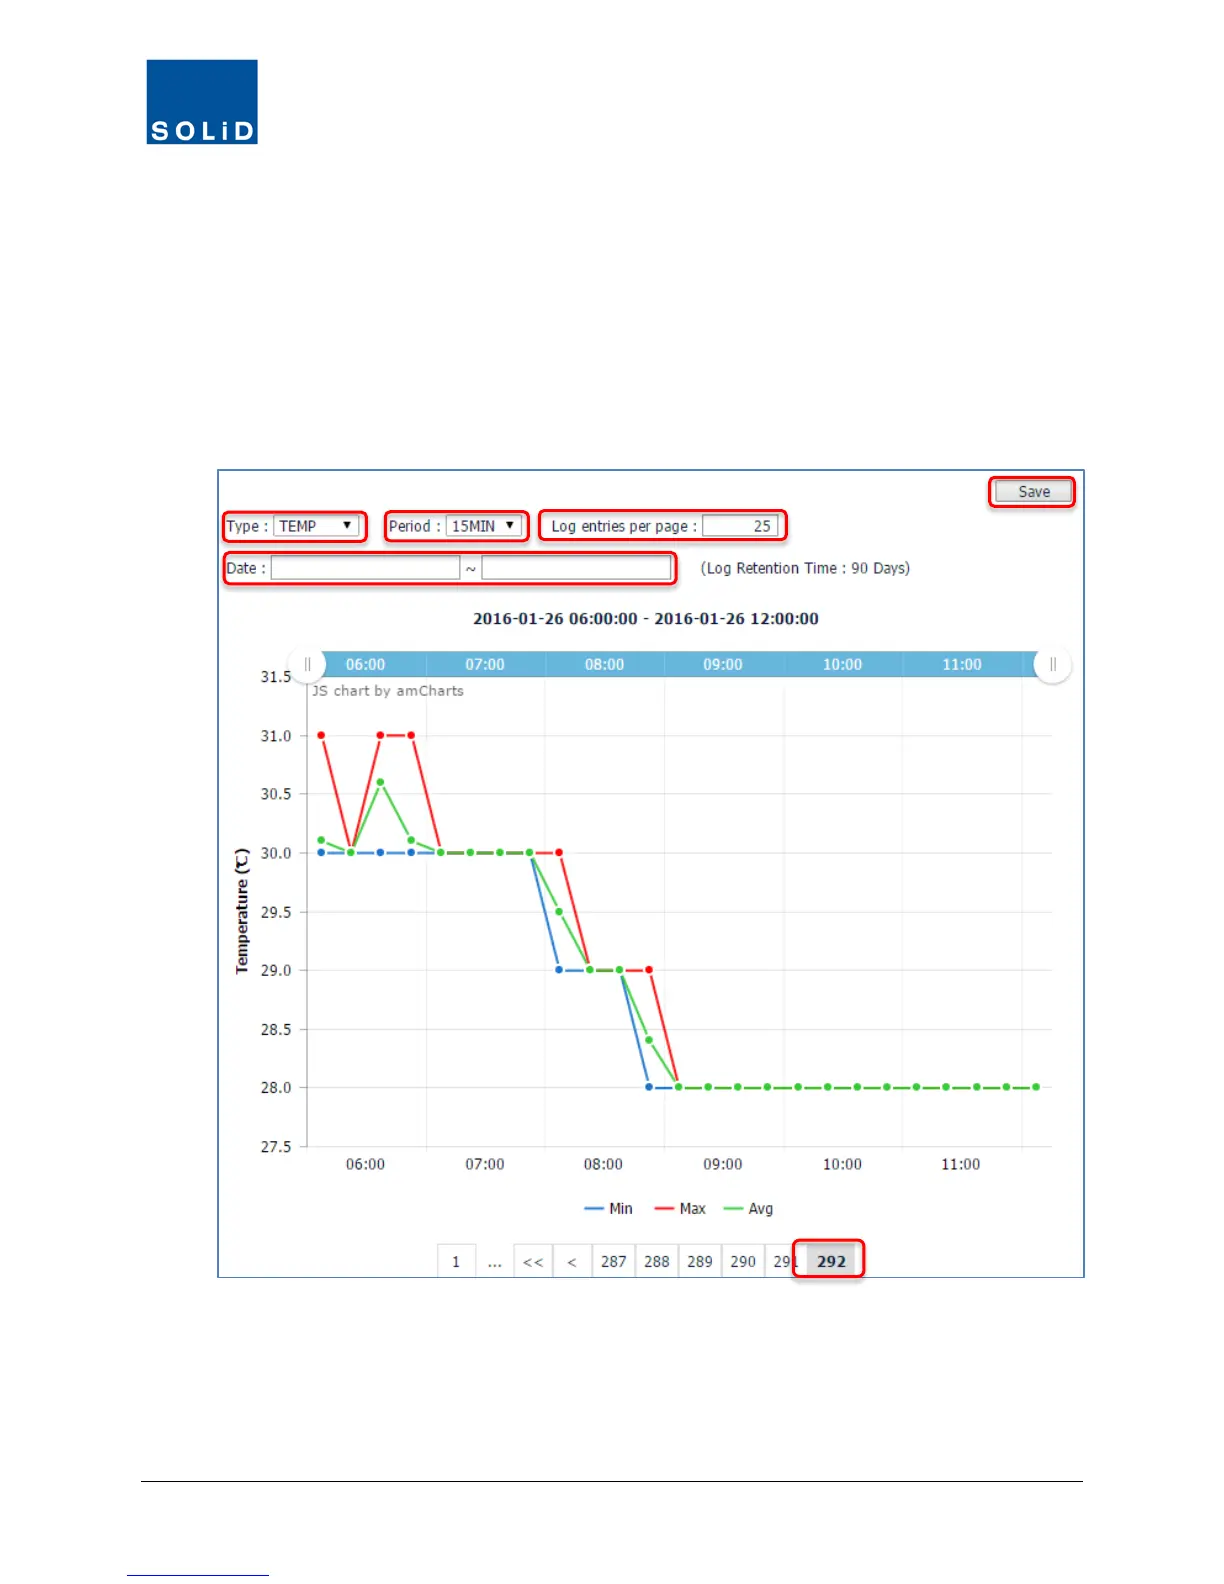
3. From the Type drop-down list, select the trend you want to see in the graph. These will vary
according to the Device.
4. From the Period drop-down list, select the time interval to be used in the graphs X axis – 15
minute or 1 day intervals.
5. Enter the number of Log entries per page.
6. Enter a Date / Time range.
The graph redraws each time you change a search field.
Figure 9.1 – Example Trend Data
7. You can move forward and backward using the scroll feature at the bottom of the graph.
8. Click Save to download a report in spreadsheet format.